Introduction
The interplay between representations of wealth, power, and identity has had a profound impact on historical and contemporary culture. Current political and social movements, including the Black Lives Matter movement, #MeToo, and even the alt-right have created extensive social and political networks which have coalesced around issues of inequality, political ideology, and shared cultural norms. A combination of social network analysis (SNA) and geographic information systems (GIS) is increasingly used to examine and understand the complexities of such communities, their role in shaping current political and social events, and the influence of geographical factors on their development. [1] SNA and GIS have also been increasingly deployed in the study of the pre-modern world, with scholarly focus primarily resting on abstract analysis of cultural interactions, networks of economic exchange, or examinations into the social context of well-known and thoroughly documented individuals. [2]
Far less attention has been paid to the problem of handling qualitative uncertainty in humanities data when using SNA and GIS. Scholars familiar with these approaches have only begun to grapple with the inherent difficulties in disseminating and analyzing uncertainty at the intersection of their respective fields. The different assumptions, objectives, and digital vocabularies of SNA and GIS has not led to any consensus as to best practices to represent highly uncertain data. Even less attention has been paid to the needs of the readers / consumers of SNA and GIS projects, who fall along a vast spectrum of differing technical skills and knowledge, and as a result often hold highly divergent digital literacies, which can hinder the effectiveness of different visualization techniques.
To engage with these issues within the context of antiquity, this paper uses the ongoing development of Social Networks and Ancient Greek Garrisons (SNAGG) as a case study. SNAGG is an effort to identify, catalog, locate, and examine ancient Greek garrison communities found in literature, papyri and epigraphy, from Archaic Greece in the sixth century BCE to the rise and expansion of the early Roman Empire in the first century CE. [3] After examining the development and findings of SNAGG, this paper addresses the study and visualization of uncertainty within SNA and GIS, which raises issues of critical importance to scholars of the ancient world. This paper does not offer a “one size fits all” approach to the problem of uncertainty in humanities data. Instead, I detail how the application of common digital vocabularies and visualization techniques, including recognizable mapping interfaces and limited use of animation, can embrace the goals of representing uncertainty while retaining analytical rigor and remaining accessible to a diverse audience.
SNAGG: Overview and Findings
SNAGG is an expansion and revision of my dissertation, Imperial Power and Local Autonomy in Greek Garrison Communities: The Phrourarchia and the Polis, submitted in 2015 at the University of North Carolina, Chapel Hill. By examining all Greek garrison communities in literature, papyri, and epigraphy until the first century CE, my research has revealed that garrison communities played a critical role in the conception of Greek civic and military identity. Greek garrisons were locations of raw physical and political domination, but were also key components in a network of often competing rhetorical, intellectual, and social constructs. By focusing on the specific terminology surrounding these garrisons, my study demonstrates how the military powers and civil authority of institution of the phrourarchia, or office of the garrison commander, fell under two broad patterns. Imperial powers used the phrourarchia to control local populations through the practice of ambiguous civic and military authority outside of the normal constitutional framework of a polis, allowing phrourarchoi, many of whom were foreign mercenaries, to support imperial regimes without any local legal or constitutional hinderances. [4] On the other hand, phrourarchoi employed by local communities for their own purposes had strictly defined limits to their military authority, and did not wield any civic powers. These phrourarchoi were concerned solely with securing the physical possessions of a polis, and were strictly controlled by the local government. Unlike their imperial counterparts, complete subordination to the law was absolutely required of any local phrourarchos, who could pay with his life for any transgressions. [5]
Support for these contentions comes from exhaustive study on the specific vocabulary surrounding the office of the phrourarchia [6] and the phrourai, phrouria, and phrouroi who supported it. All of these terms are related to the verb φρουρέω (phroureō), to watch, and all of these terms remained connected with continued observation within a military setting. [7] Phroura generally denoted a garrison or a watch, and could refer to the military forces of the garrison. Phrourion was most often used in reference to a physical location, such as a fortress, although one that was generally smaller that a phroura. These garrisons and structures were generally occupied by men who were referred to as phrouroi. Perhaps the most important magistracy associated with phroura, phrouria, and phrouroi was the office of the phrourarchia, which was held by individuals referred to as phrourarchoi (singular phrourarchos). The phrourarchia was, unlike more generic terms such as archon or hegemon, an office with unique powers and responsibilities. [8]
Through a combination of keyword searches in the TLG, SEG, PHI, Papyri.info, and manual perusal of print sources, at the time of this writing SNAGG has gathered over 2,500 mentions of phrourarchoi, phrourai, phrouria, and phrouroi that I consider historically or culturally relevant. Entries where an author refers to the same location with the same terminology were then combined into a single record, while variations in terms for specific locations are treated as separate entities. This data refinement revealed that there are 1,430 unique individual garrison communities. Unfortunately, named commanders are unknown for the vast majority of phrourai, phrouria, and phrouroi, as individual commanders or their titles are only mentioned on 223 occasions, representing ~15.5% of the known total. [9] This data is presented below in tables 1 and 2.
Table : Garrison Types with Commanders Specified
| Type | Instances |
| phroura (?) | 1 |
| phroureo | 1 |
| phrourion (?) | 2 |
| phrouros | 12 |
| other [10] | 14 |
| phrourion | 15 |
| phroura | 17 |
| unspecified | 161 |
| Total | 223 |
Table : All Garrison Commanders
| Commander Title | Instances |
| epi phroura | 4 |
| polemarchos | 4 |
| epi | 5 |
| echo | 7 |
| hegemon | 26 |
| archon | 21 |
| harmostes | 22 |
| strategos | 34 |
| titles with two or less entries | 41 |
| phrourarchos | 54 |
| unspecified | 1212 |
| Total | 1430 |
The data reveals that, perhaps unsurprisingly, the office of the phrourarcos was the most common known title for commanders of phrourai, phrouria, and phrouroi. Further analysis of this language within its literary context reveals that all of these terms were not generic designations for garrisons that were uncritically chosen by ancient authors. Instead, these words were used carefully in specific contexts, and an author’s relationship to imperial power could play a significant factor in his decision to use the term phrourarchos. [11] For example, perhaps motivated by his own distaste for Athenian imperialism, the only phrourarchoi found under Greek administration in Xenophon occur in his Socratic dialogues, which deal with metaphysical speculation, not historical fact. [12] Xenophon had no such qualms referring to commanders in the Persian empire as phrourarchoi, including officers who served under Cyrus the Younger in Ionia in 401 BCE. [13] Conversely, later authors who were deeply imbedded within Roman administration, such as Arrian, treated phrourarchoi as simply a common feature of imperial bureaucracy. [14] Arrian used phrourarchoi to describe commanders under both Alexander and the Persians, and his command of Greek technical military vocabulary strongly suggests that his usage was not simply a slip of the pen. [15]
This analysis also featured some data with a high degree of uncertainty. Some authors would use terms like phroura and phrourion in lists of places or positions in their narratives where it was impossible to disambiguate which specific location they were discussing. Most often this is occurred when an author switched from a general description of a region that contained garrisons, then discussed locations which implied the presence of garrisons without using any technical terminology. Furthermore, the exact geographic extent of the responsibilities of a phrourarchos or other commander are not always clear, so some of the assignments of particular commanders to specific locations is provisional. [16] These instances were flagged in the database, with numerical values from 1-3 representing nearly certain, probable, and highly uncertain levels of confidence.
SNAGG: Mapping and Digital Literacies
Given the sheer scope of the project and the wealth of geographically rich information, the data behind SNAGG provided an excellent base for the creation of a GIS application. All of SNAGG‘s data was entered into a geodatabase that was aligned with Pleaides project identifiers by hand, as transliterations, Greek text, and multiple locations with the same name created enormous difficulties with automated matching. Pleiades identifiers were chosen for SNAGG as they have become the de facto standard for identifying unique geographic places within the ancient world linked data community. [17] For this first map little attention was paid to visualization of uncertainty. Instead, the map presented all garrisons in one color (orange circles) and their commanders in another (white circles), along with a visual representation of the density of garrisons as found in the source material. Limited interaction is given by the presence of popups, which provide further information when a particular place is clicked on the map, and a searchable database which can be accessed by clicking on the magnifying glass icon to the left of the screen (Figure 1).
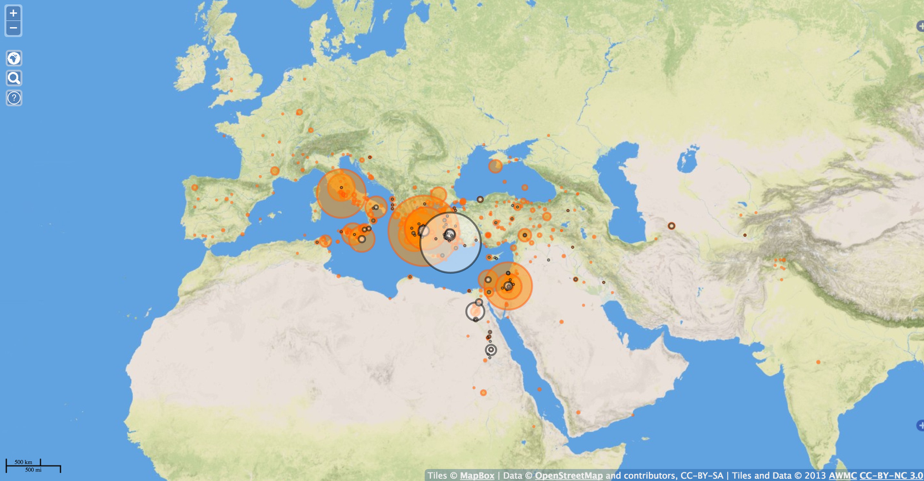
Figure 1: SNAGG Overview Map
This is not to say that all representations of uncertainty are absent from this application. Entries which are questionable are simply marked as such in the database (Figure 2). In this table, Title is often a place name derived from the Pleiades gazetteer, but it can also be a short hand descriptive phrase (like an unnamed Athenian phrourai) where the presence of a garrison is known but its local name is not. Type is the terminology used to describe garrison; sometimes this is unknown as only the presence of a commander is attested at the place. Commander is, if known, the greek term used to designate the leader of a garrison, while Sources lists the attestations of the place. Finally, the Pleiades ID links the garrison to a place record in the Pleiades gazetteer. Any garrisons that were not specifically listed in Pleiades were added to the gazetteer through its normal editorial process, or were linked to a larger regional entity if finding a specific location proved impossible.
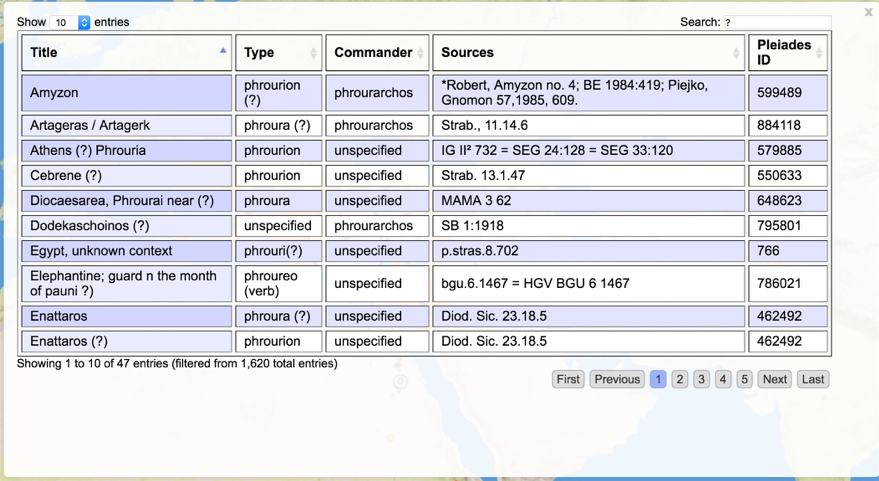
Figure 2: SNAGG Database Sample
By creating this mapping resource for SNAGG, it was quickly apparent that the visual vocabulary (namely the interface, data visualizations, and application functionality) shared between OpenLayers and Google maps, while intuitive for most users, did not capture the inherent uncertainties in the data itself. Furthermore, SNAGG contains extensive social network information that is not necessarily geospatial, but can nevertheless be used and extended to link phrourarchoi to other individuals and geographic locations. As such, establishing a single location for many phrourarchoi and their superiors is often impossible. Given these difficulties, SNAGG‘s development then turned to other initiatives to determine current best practices for visualizing uncertain data in GIS and SNA applications.
Uncertainty, GIS, and SNA
Although the majority of GIS research and applications in the humanities have focused on quantitative issues, there has been an increasing use of GIS to address complex data sets, notably through the use of digital gazetteers and other tools to disambiguate names, classifications, and locations for conceptually different geographic entities. [18] GIS is also increasingly used to identify spatial relationships, especially by using data from investigations which did not originally focus on geographic analysis, as a starting point for further work. [19] Both of these approaches, and indeed any historical investigation, will inevitably produce and interact with data that is by its very nature ambiguous and uncertain.
The inherent ambiguity of much historical data is, however, notably different from the type of uncertainty that is generally dealt with in the use of GIS and SNA in the physical and social sciences. Modeling uncertainty in scientific GIS applications has long been recognized as a difficult intellectual and technical undertaking, but most treatments of uncertainty have been notably preoccupied with quantitative questions, where concerns over numerical inaccuracy, not larger conceptual questions, are the norm. [20] Such issues are often reflective of a desire to represent the physical environment, notably in the creation of elevation models, where poor instrumentation, imprecise measurements, statistical errors, or other issues hinder accurate representations. [21] Behind much of this work is the assumption that reality, despite its complexities, is certain, and therefore uncertainty in GIS data is caused either by incomplete conceptualization or errors in the process of data measurement or management. [22] This is not the case for much work in the humanities, where differing interpretations of events, sparse data sets, and other issues result in what is often called “fuzzy” data, which is exceedingly difficult to quantify with existing GIS or quantitative approaches. [23]
As a result, much of the work on visualizing and presenting uncertainty in GIS applications has focused on data that falls within a predictable, quantifiable range. Many projects have grappled with the often competing demands between scientific fidelity and legibility, and there is an increasing recognition that some approaches may lead to information overload, where a user is simply overwhelmed by different visualization approaches. [24] Due to a combination of qualitative problems and a digital vocabulary that is markedly different from humanities practitioners, the work of geographers and environmental scientists on uncertainty has had limited impact in the digital humanities. Many scholars and readers of GIS projects retain a perception that digital maps are authoritative and accurate representations of reality, not least due to the ever improving ability of GIS software to present a highly polished, professional looking product, even if the underlying data is highly problematic. [25] The attempts of many GIS applications to mimic the functionality and display of heavily used and highly trusted applications like Google Maps have, perhaps unconsciously, drawn upon a digital literacy that rarely questions the accuracy of digital products.
Echoing the focus of GIS research, discussions surrounding uncertain data in SNA have displayed a similar preoccupation with quantitative issues. Scholars have long believed that missing, incomplete, or uncertain data is difficult to model in SNA, not least because of the profound effects on network structures if key components of the network are missing. [26] Due to the extreme volatility of common network analysis, work on uncertainty in SNA has focused on the development of estimating quantitative uncertainty. Some recent work on SNA uncertainty has assumed that the underlying structure of the network is known and nearly complete, and has focused instead on the probability of an individual to perform actions given their placement in a network, or attempted to estimate the quantity of social interactions in both human and animal groupings. [27]
Even less attention has been paid to the representation of uncertain data in SNA. Although many graphs use simple visual cues, such as dashed lines, or taking the term “fuzzy data” literally (by visually defocusing and distorting elements in a graph) to indicate problematic connections, there has been little effort to further expand and refine treatment of uncertain data. [28] One issue is that SNA already has a visual literacy built on animation, where movement in a graph often indicates an incomplete computational task instead of actual movement or uncertainty in the graph itself. [29] Another issue has been that large-scale social networks reduce the confidence that data about individuals and their relationships is accurate, while small networks can be easily checked by hand to ensure data integrity. [30] However, even in these smaller networks there is still the problem of that the fact of a relationship may itself be uncertain, especially in data sets dealing with the ancient world.
Beyond issues which are unique to each field of study, the very act of communicating GIS and SNA results can lead to an increase in data uncertainty. [31] The conceptual models underlying visualizations can not capture all of the complexity of a diverse and fuzzy data set, and the assumptions and digital literacy of a project creator will almost certainly differ from a project user. [32] These difficulties have even led some in the GIS community to question the utility of visualizing uncertainty at all, especially if the resulting product overcomplicates intuitive displays. [33]
SNAGG: Data Visualization and Digital Literacy
Given the fragmented and often exploratory nature of engaging with uncertainty in GIS and SNA applications explored above, SNAGG is currently experimenting with several different approaches to data visualization. As the initial map does provide a clean, intuitive interface, it has been retained in the application to provide a quick overview of the location and quantification of garrisons. This map is undergoing constant refinement, and will soon feature a chronology slider allowing a user to explore changes in garrisons over time.
The most recent initiative in SNAGG is the creation of a social network and map that combines geospatial locations with the social networks built by phrourarchoi and their commanders. Visualizing networked entities, especially schematically, has long been a feature of geospatial analysis. Projects such as Stanford’s ORBIS application offer excellent data visualizations that highlight the connectivity of complex systems, such as trade networks in the ancient Mediterranean (Figure 3). [34]
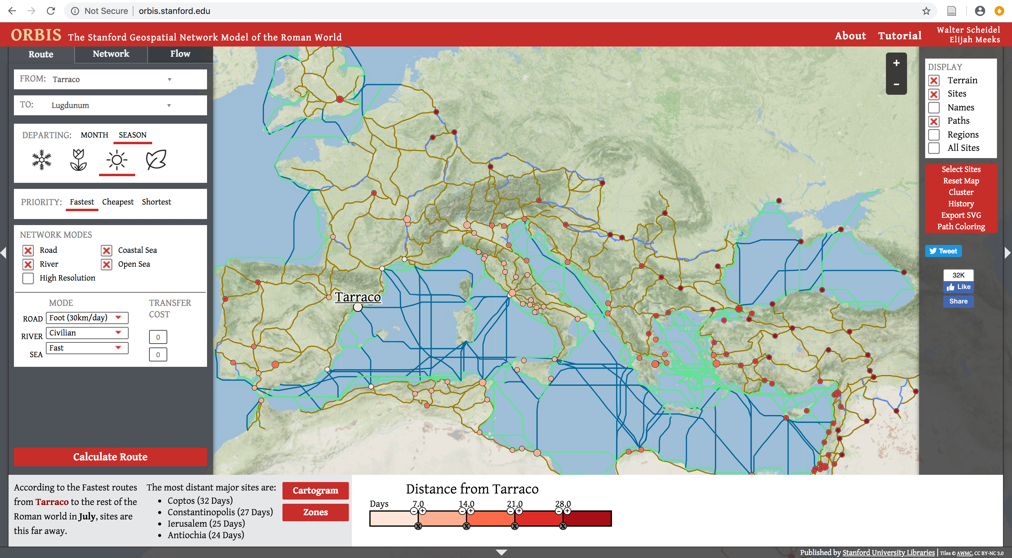
Figure 3: ORBIS schematic Network
SNAGG goes a few steps further. While the physical garrisons and other communities relevant to the study are still treated as fixed points on a map, phrourarchoi and other individuals who are not geographic entities are data points a force-directed graph, created with D3.js, which is then integrated into to the map itself. As the fixed places are also treated as nodes in this application, it is possible for individuals who were associated with only one location to be displayed in a close proximity to that place (to avoid visual confusion between places and people), while individuals who have multiple geographic links are animated, which makes them “bounce” between separate locations. This allows a user to see, for instance, that commanders who are associated with only one place remain relatively stable on the map, while phrourarchoi in locations like Cnidus, where there is some controversy as to status as Cnidian or Rhodian office holders, move between the two locations. [35] Different colors on the nodes indicate different classifications: blue for geographic entities, red for phrourarchoi, purple for other officers, and green for monarchs and other non-military officials. (Figure 4).
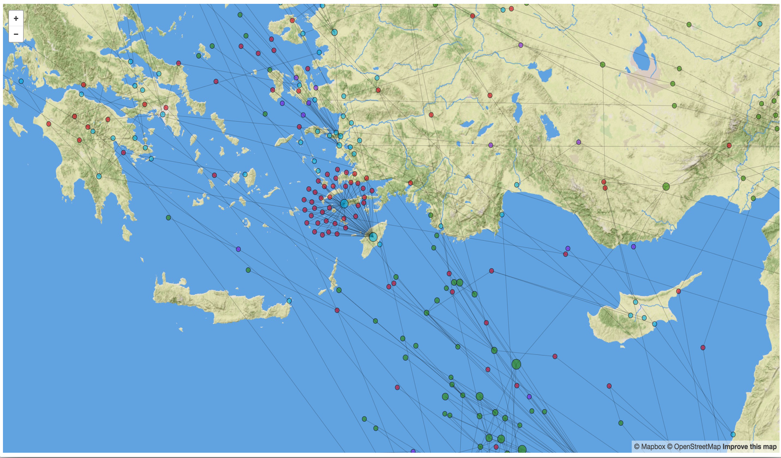
Figure 4: SNAGG Social Network and Map
This “social-spatial” combination of known geographic features with largely non-geospatial social network analysis is a new approach in historical studies. Previous attempts to model historical networks have either focused on the social network independent of geography, or on connections between fixed locations without introducing non-geographic entities. [36] The power of this approach is that an approximation of the embedded spatial contexts of social networks are displayed on a map, which presents an intuitive and powerful tool for research and analysis. Furthermore, when combined with other digital techniques, like modeling the shortest, least expensive, or fastest routes between places, the resulting visualizations have the potential to dramatically change how concepts of territory, connectivity, and movement are displayed on maps.
Although this new approach does showcase uncertain data, it has vastly increased the visual complexity of the application. In addition, the combination of SNA and GIS highlights the overlap and conflict between different digital literacies for visualizations. As discussed previously, while movement on a map often indicates travel or movement in time, movement on a force directed graph for a social network most often represents an incomplete computational process. Therefore, a user who is familiar with the visual conventions of SNA software will most likely approach a moving network graph with a completely different set of expectations and assumptions than a user from a GIS background.
SNAGG: Further work
Despite its inability to seamlessly display all data inputs in a visually alluring way, the software and techniques used by SNAGG are at the forefront of visualizing uncertainty in GIS and SNA humanities applications. Further experimentation may reveal a threshold under which animating uncertain geographic and social data provides a powerful visualization that reduces confusion instead of compounding it. In addition, SNAGG is beginning to test different visual cues outside of animation, including the simple use of different colors and shapes where appropriate.
The work so far with SNAGG has also shown potential limitations within SNA and GIS for scholars of the ancient world. SNAGG‘s original, simple map effectively and intuitively presented garrison communities and their commanders within geographic space, while the display of complex social networks within GIS systems has proven to be more problematic. The potential for effectively displaying social connections in a geographic context is enormous, but the ongoing work on SNAGG has reinforced is that there is not a single, simple solution to the problem of visualizing fuzzy humanities data.
Conclusion
Despite increasing scholarly interest in addressing uncertain and fuzzy data, little attention has been paid to modeling and visualizing uncertain qualitative data. As more digital initiatives for the study of the ancient world combine different software components, techniques, and epistemological approaches, the problem of uncertainty will become increasingly acute. Outside of the subject matter of any particular project, digital scholars of the ancient world are starting to grapple with divergent user expectations, different visualization conventions, and interlocking digital literacies, while still trying to communicate the complexities inherent in all humanities research. It is vitally important that further cooperation and discussion around best practices for dealing with complex humanities data sets occur.
Fortunately, there is already an excellent model of digital collaboration for scholars in ancient studies. There is a flourishing community around the creation and propagation of linked data standards, [37] and many projects are also collaborating through the Pelagios Commons to discover and link common geographic data through a set of unique identifiers. [38] Following theses models, perhaps with an eye to creating a common yet still expansive visual vocabulary, is a logical next step for addressing uncertainty in humanities computing.
Any such conversation must include social and geoscience practitioners. Although there are many methodological and epistemological differences between the sciences and humanities, the use of common software tools as to how uncertainty is conceptualized, modeled within a database, and ultimately visualized presents a unique opportunity to address a fundamental concern for both fields.
Bibliography
Adar, E., and C. Re. 2007. “Managing Uncertainty in Social Networks.” IEEE Data Eng. Bull. 30:15–22.
Alexander, M.C., and J.A. Danowski. 1990. “Analysis of an Ancient Network: Personal Communication and the Study of Social Structure in a Past Society.” Social Networks 12:313–335.
Baker, A. 2013. “Vernacular GIS: Mapping Early Modern Geography and Socioeconomics.” History and GIS: Epistemologies, Considerations and Reflections, 89–110.
Barker, E., L. Isaksen and J. Ogden. 2016. “Telling Stories with Maps: Digital Experiments with Herodotean Geography.” In New Worlds from Old Texts: Revisiting Ancient Space and Place, eds. E. Barker et al., 181–224.
Baz, F. 2007. “Ein neues Ehrenmonument für Flavius Arrianus.” ZPE 163:123–127.
Berman, M. L. 2005. “Boundaries or Networks in Historical GIS: Concepts of Measuring Space and Administrative Geography in Chinese History.” Historical Geography 33:118–133.
Borgatti, S. P., K. M. Carley, and D. Krackhardt. 2006. “On the Robustness of Centrality Measures Under Conditions of Imperfect Data.” Social Networks 28:124–136.
Bosworth, A. B. 1977. “Arrian and the Alani.” Harv. Stud. 81:217–255.
———. 1993. “Arrian and Rome: The Minor Works.” Aufstieg und Niedergang der römischen Welt (ANRW) : Geschichte und Kultur Roms im Spiegel der neueren Forschung, 226–276.
Brughmans, T. 2012. “Facebooking the Past: A Critical Social Network Analysis Approach for Archaeology.” In Thinking Beyond the Tool: Archaeological Computing and the Interpretive Process, eds. A. Chrysanthi et al., 191–203.
Cline, D. H. 2012. “Six Degrees of Alexander: Social Network Analysis as a Tool for Ancient History.” Ancient History Bulletin 26:59–70.
Collins, C., M. S. T. Carpendale, and G. Penn. 2007. “Visualization of Uncertainty in Lattices to Support Decision-Making.” Proceedings of the 9th Joint Eurographics / IEEE VGTC Conference on Visualization, 51–58.
Dillery, J. 1995. Xenophon and the History of His Times. London; New York.
Farine, D. R., and A. Strandburg-Peshkin. 2015. “Estimating Uncertainty and Reliability of Social Network Data Using Bayesian Inference.” Royal Society Open Science 2.
Fraser, P. M., and G. E. Bean. 1954. The Rhodian Peraea and Islands. London.
Given, J. 2014. The Fragmentary History of Priscus: Attila, the Huns and the Roman Empire, AD 430-476. Merchantville, NJ.
Gregory, I. N., and A. Geddes. 2014. “Conclusions: From Historical GIS to Spatial Humanities: Challenges and Opportunities.” Toward Spatial Humanities: Historical GIS and Spatial History, 172–185.
Horne, R. 2015. Imperial Power and Local Autonomy in Greek Garrison Communities: The Phrourarchia and the Polis. PhD Diss., University of North Carolina, Chapel Hill.
Hu, Y. 2005. “Efficient, High-Quality Force-Directed Graph Drawing.” Mathematica Journal 10:37–71.
Jansen, J. N. 2007. After Empire: Xenophon’s poroi and the Reorientation of Athens’ Political Economy. PhD Diss., University of Texas.
Jefremow, N. 1995. Die Amphorenstempel des hellenistischen Knidos. München.
Jessop, M. 2006. “Dynamic maps in humanities computing.” Human IT: Journal for Information Technology Studies as a Human Science 8:68–82.
———. 2008. “The Inhibition of Geographical Information in Digital Humanities Scholarship.” Literary and Linguistic Computing 23:39–50.
Koehler, C. G., and P. M. Wallace Matheson. 2004. “Knidian Amphora Chronology, Pergamon to Corinth.” Transport Amphorae and Trade in the Eastern Mediterranean: Acts of the International Colloquium at the Danish Institute at Athens, September 26-29, 2002, 163–169.
Laskey, K. B., E. J. Wright, and P. C. G. da Costa. 2010. “Envisioning Uncertainty in Geospatial Information.” International Journal of Approximate Reasoning 51:209–223.
Lendon, J. E. 2006. “Xenophon and the Alternative to Realist Foreign Policy: ‘Cyropaedia’ 3.1.14-31.” JHS 126:82–98.
Lima, L., et al. 2018. “Inside the Right-Leaning Echo Chambers: Characterizing Gab, an Unmoderated Social System.” arXiv preprint.
MacEachren, A. M., et al. 2005. “Visualizing Geospatial Information Uncertainty: What We Know and What We Need to Know.” Cartography and Geographic Information Science 32:139–160.
Manikonda, L., et al. 2018. “Twitter for Sparking a Movement, Reddit for Sharing the Moment: #metoo through the Lens of Social Media.” arXiv preprint.
Nankov, E. 2009. Phrouria Lokrika: Aspects of Military Presence in Hellenistic Opountian Lokris. PhD Diss., Cornell University.
Plewe, B. 2002. “The Nature of Uncertainty in Historical Geographic Information.” Transactions in GIS 6:431–456.
Pownall, F. 2004. Lessons from the Past: The Moral Use of History in Fourth-Century Prose. Ann Arbor.
Radil, S. M., C. Flint, and G. E. Tita. 2010. “Spatializing Social Networks: Using Social Network Analysis to Investigate Geographies of Gang Rivalry, Territorially, and Violence in Los Angeles.” Annals of the Association of American Geographers 100:307–326.
Riedel, S. 2013. “Hellensitic Pottery in a Wider Perspective – On the Use and Misuse of the Application of Network Theory to Material Culture.” In Networks in the Hellenistic World: According to the Pottery in the Eastern Mediterranean and Beyond, eds. N. Fenn and C. Römer-Strehl, 371–76. Oxford.
Smith, M. L. 2005. “Networks, Territories, and the Cartography of Ancient States.” Annals of the Association of American Geographers 95:832–849.
Staal, S., et al. 2002. “Location and Uptake: Integrated Household and GIS Analysis of Technology Adoption and Land Use, with Application to Smallholder Dairy Farms in Kenya.” Agricultural Economics 27:295–315.
Syme, R. 1982. “The Career of Arrian.” Harv. Stud. 86:181–211.
Tremayne, M. 2014. “Anatomy of Protest in the Digital Era: A Network Analysis of Twitter and Occupy Wall Street.” Social Movement Studies 13:110–126.
Tuplin, C. 1993. The Failings of Empire: A Reading of Xenophon Hellenica 2.3.11 – 7.5.27. Stuttgart.
Vandeviver, C. 2014. “Applying Google Maps and Google Street View in Criminological Research.” Crime Science 3:1–13.
Vlassopoulos, K. 2007. “Beyond and Below the Polis: Networks, Associations, and the Writing of Greek History.” Mediterranean Historical Review 22:11–22.
Footnotes
[ back ] 1. Radil, Flint and Tita 2010:311–22; Tremayne 2014:114–22. Manikonda et al. 2018; Lima et al. 2018.
[ back ] 2. Staal et al. 2002:298–314; Berman 2005:121–132; Vlassopoulos 2007:13–19; Alexander and Danowski 1990:321–335; Brughmans 2012:195–201; Cline 2012:64–70. See Riedel 2013:375 for further analysis on the use of network analysis in archaeology.
[ back ] 4. See IG I3, 14, Diodorus Siculus, Library 18.18.5 for some examples.
[ back ] 5. SEG 30, 1376; I. Priene 22.
[ back ] 6. There is an extremely rare verb φρουραρχέω, with the only unambiguous reference in Plutarch, Dion 11.
[ back ] 7. LSJ s.v. φρουρά, φρουραρχέω, φρουρέω, φρουρός; Nankov 2009:4.
[ back ] 8. Although what follows is not a definitive or edited list, for a sense of scale, the TLG contains 14,710 instances of hegemon, 23,457 instances of archon, and only 216 instances of phrourarchos (along with all of their derivatives). These numbers are similar in other corpora: PHI lists 860 instances of hegemon, 2,500 of archon, and 116 of phrourarchos; papyri.info contains 991 instances of hegemon, 2,579 for archon, and 31 for phrourarchos; and at the time of this printing the SEG contains 303 instances of hegemon, 1,819 of archon, and 56 for phrourarchos. See Horne 2015:93–168 for an overview of the civic and military responsibilities of phrourarchoi in imperial and local contexts.
[ back ] 9. See http://awmc.unc.edu/awmc/applications/snagg/database for a complete list of all garrisons in the study.
[ back ] 10. “Other” indicates a garrison where phrouroi or phrourarchoi were present, but the author referred to the garrison itself by a term not included in the table.
[ back ] 11. Horne 2015:23–64 for a full treatment of the relationship between ancient authors, imperialism, and phrourarchoi.
[ back ] 12. Xenophon, Memorabilia 4.4.17. For analysis on Xenophon’s views of Athenian Imperialsim see Tuplin 1993:166–67; Pownall 2004:179; Lendon 2006:98; cf. Dillery 1995:7; Jansen 2007:207–282.
[ back ] 13. Xenophon, Anabasis 1.1.6.
[ back ] 14. Syme 1982:181–213; Bosworth 1977:217–218; Baz 2007:123.
[ back ] 15. Arrian, Anabasis 1.17.3, 2.1.5, 3.16.9, 3.5.3, 4.16.5; Arrian Tactica 1.2-3; Bosworth 1993:253–272.
[ back ] 16. Smaller communities, however, were very clear as to the geographic limits of a phrourarchos’ authority. See I. Priene 19, 21, and 22.
[ back ] 17. Given 2014:86–89; Barker, Isaksen and Ogden 2016:218–21.
[ back ] 18. For example. the Pleiades project (http://pleiades.stoa.org/) provides a unique identifier along with name and location disambiguation for over 35,000 unique places in the ancient Mediterranean world.
[ back ] 19. Jessop 2008:40–41.
[ back ] 20. Gregory and Geddes 2014:174; MacEachren et al. 2005:140–57; See Plewe 2002:443–54 for one such example.
[ back ] 21. See Laskey, Wright and da Costa 2010:210 for an example.
[ back ] 22. Plewe 2002:437.
[ back ] 23. Jessop 2006:73
[ back ] 24. MacEachren et al. 2005:146–155; Laskey, Wright and da Costa 2010:218.
[ back ] 25. Vandeviver 2014:3–5; Baker 2013:104.
[ back ] 26. Borgatti, Carley and Krackhardt 2006:124–125.
[ back ] 27. Adar and Re 2007:1–2; Farine and Strandburg-Peshkin 2015:2.
[ back ] 28. Collins, Carpendale and Penn 2007:52–57.
[ back ] 29. See Hu 2005:37–53 for some example calculations. Software such as Gephi (https://gephi.org/) and D3.js (https://d3js.org/) animate nodes while such computational work is performed on the network.
[ back ] 30. Adar and Re 2007:1.
[ back ] 31. Plewe 2002:437.
[ back ] 32. Plewe 2002:436.
[ back ] 33. MacEachren et al. 2005:156.
[ back ] 35. Fraser and Bean 1954:93–94; Jefremow 1995:43; Koehler and Wallace Matheson 2004:167–168.