Patrick Andrist, University of Munich
1. Structural Codicology and the Syntactical Descriptions of Manuscripts Books
Structural codicology is the name recently given to a branch of codicology focusing on the structure of ancient and medieval codices using a holistic approach.* It was founded by Peter Gumbert, who theorised this approach around the now often used (and sometimes abused) concepts of “codicological unit” and “bloc.” Although Gumbert was certainly not the first scholar to be interested in the structure of the codices, [1] he first proposed a method for describing codices around their historical “building blocs” and established a complete system and terminology to analyse them along these lines in 2004. [2] In the years following this publication, I had the pleasure to work with the late Paul Canart and Marilena Maniaci to build on Gumbert’s work (in dialogue with him) and to publish our Syntaxe du codex in 2013. [3]
One of the ambitions of structural codicology is to create manuscript book descriptions which reflect both the historical layer and the internal architecture of codices. Several projects of printed catalogues have (directly or indirectly) shown awareness of the work done by Gumbert and ourselves and produced so-called syntactical descriptions of manuscripts, i.e. organised around the main historical layers of the codex. [4] For electronic manuscript descriptions, several websites do allow for (for example, e-codices) or encourage (Pinakes, Beta maṣāḥǝft to name but two) the creation of descriptions organised along these lines. [5] The recently released web site Manuscripta Biblica of the Paratexts of the Bible project is, to my knowledge, the first public interface where all the full descriptions strive follow “syntactical” principles. [6] However, as explained below, none of these platforms are presently able to represent the internal architecture of codices, not to mention the possibility of visualising them in different ways, or to exploit the information about their structure using other tools or functions. [7]
Since overcoming these limits, not just in order to visualise more meaningful descriptions but also to develop dynamic tools around them, has been one of my preoccupations for a long time, I took the preparation of an interdisciplinary project on antique and medieval biblical manuscripts as an opportunity to discuss some of my ideas with a working group of manuscript and digital humanity specialists, which met at the LMU University of Munich in 2019. [8] Our intention was to think about a new database with which we hope, among several goals, to compare codices from various cultural areas by taking into account not only their contents but also their physical makeup and their overall architecture.
This paper continues the reflection on some of the points discussed in our working group. It presents some of the goals for new features and tools and their functioning (potentially in a public Virtual Research Environment). It advocates for the development of a new generation of databases whose data model allows for developing these descriptions and tools. We will frame our paper by outlining four “theses” concerning this new generation of databases on ancient manuscripts.
All these programmatic reflections are presented as a contribution to the realisation of the database aspect of the above-mentioned comparative project once it has received the requested funding. [9] However, ultimately, such tools may be of interest for anyone studying the materiality and the structures of ancient manuscripts.
2. Multiple and Flexible Description Models
Today, most manuscript databases allow for descriptions to be visualised in only one way, which corresponds to the decisions of whoever conceived the database, the public interface designers and sometimes also the cataloguers. If the designers decide that the information about the content of a codex is displayed first and the quires are described at the end (or not at all), there is not much the user of the database can do to change this.
What’s more, in most cases, the way the information about the manuscript is organised in a description (i.e., the description model) is simply a reflection of the way the data is organised internally in the database (i.e., the internal data model). For example, if for a single manuscript, a database has all the texts described in one dedicated table (or under the same <ms_contents> tag), and at the same time, it groups together all the scribes in another dedicated table (or under a <handDesc> tag at the same level as the content tag), the readers will usually see a description in which all the texts are displayed together, then all the scribes and so forth.
The solution we envision for this limitation builds on the ability of computers, contrary to printed material, to differentiate to a large extent between the data itself and the way this data is visually organised. Thus, there are no reasons why a new generation of databases should limit the display of a manuscript to one unique description model per set of internal data. It should rather provide the users with the option of choosing between various models, based on the same set of internal data, and leave the door open for creating and integrating new or improved ones, such as the ones that will be presented below. [10] To continue with the example from the preceding paragraph, the user should be able to choose to display the texts according to their scribes (or the inverse), or to go back to the traditional model in which the information about each feature is presented separately.
Secondly, within each description model, users should also be able to decide which information is displayed, and in which order, and also in which order the entries should be arranged. This is already possible in many applications outside the realm of manuscript studies. For example: if, to begin with, users see a description in which the contents of the manuscript are displayed in a tabular form (e.g., author, title, incipit etc.), they should be able to decide which columns are displayed and which ones remain hidden, their size and their order. The presence of these types of functions might seem rather basic and self-evident (to the extent that one might wonder why they are not available in current database interfaces) but it is a regrettable fact that many database projects operate on small budgets that limit how much they can offer users.
Thesis 1
The first theoretical implication of this goal is that the description models should, as much as possible, remain disconnected from the data model. The internal data model should be designed in such a way that it is easy to generate differently structured descriptions based on various description models.
3. A Tool to Help Interpret the Architecture of the Codex
Before presenting this central tool for the study of complex manuscripts, it is useful to recall some concepts about the architecture of the ancient codex by considering, as a single example, the codex Vaticanus of the Bible. [11] Diagram 1 below presents my interpretation of this codex (i.e. the way I understand its main historical layers and its architecture), [12] but I would like to note that other people, focusing on other aspects of the codex, might come up with other ways to understand its architecture. In this codex, I see four main structural levels:
- two main Production Units (UniProds) consisting of all the folios copied in the 4th cent.
on the one hand (= UniProd A), and on the other hand, all the folios copied when the codex was restored in the 15th cent. (in yellow on the diagram; = UniProd B); [13]
- inside the original UniProd:
a. two modular discontinuities (the red lines in the diagram [14] ) dividing the codex into three Modular Units;b. six Unbroken Series determined by formal anomalies in the transition between two biblical books (the green lines);c. two minor discontinuities (the blue lines).
As Diagram 1 below illustrates, one of the main results of this analysis is the identification of a major discontinuity, just before quire 49, between two Modular Units, two Unbroken series, two hands as well as two traditional collections of books of the Old Testament. This can hardly occur by chance, especially since the last quire of the ending of the Modular Unit (= quire 48) is irregular. In contrast to modern assertions which state that the codex Vaticanus is one of the two earliest Bible in one volume, the producers clearly made a book which could be bound into two volumes, and there is no evidence that it was not first organised in this way.
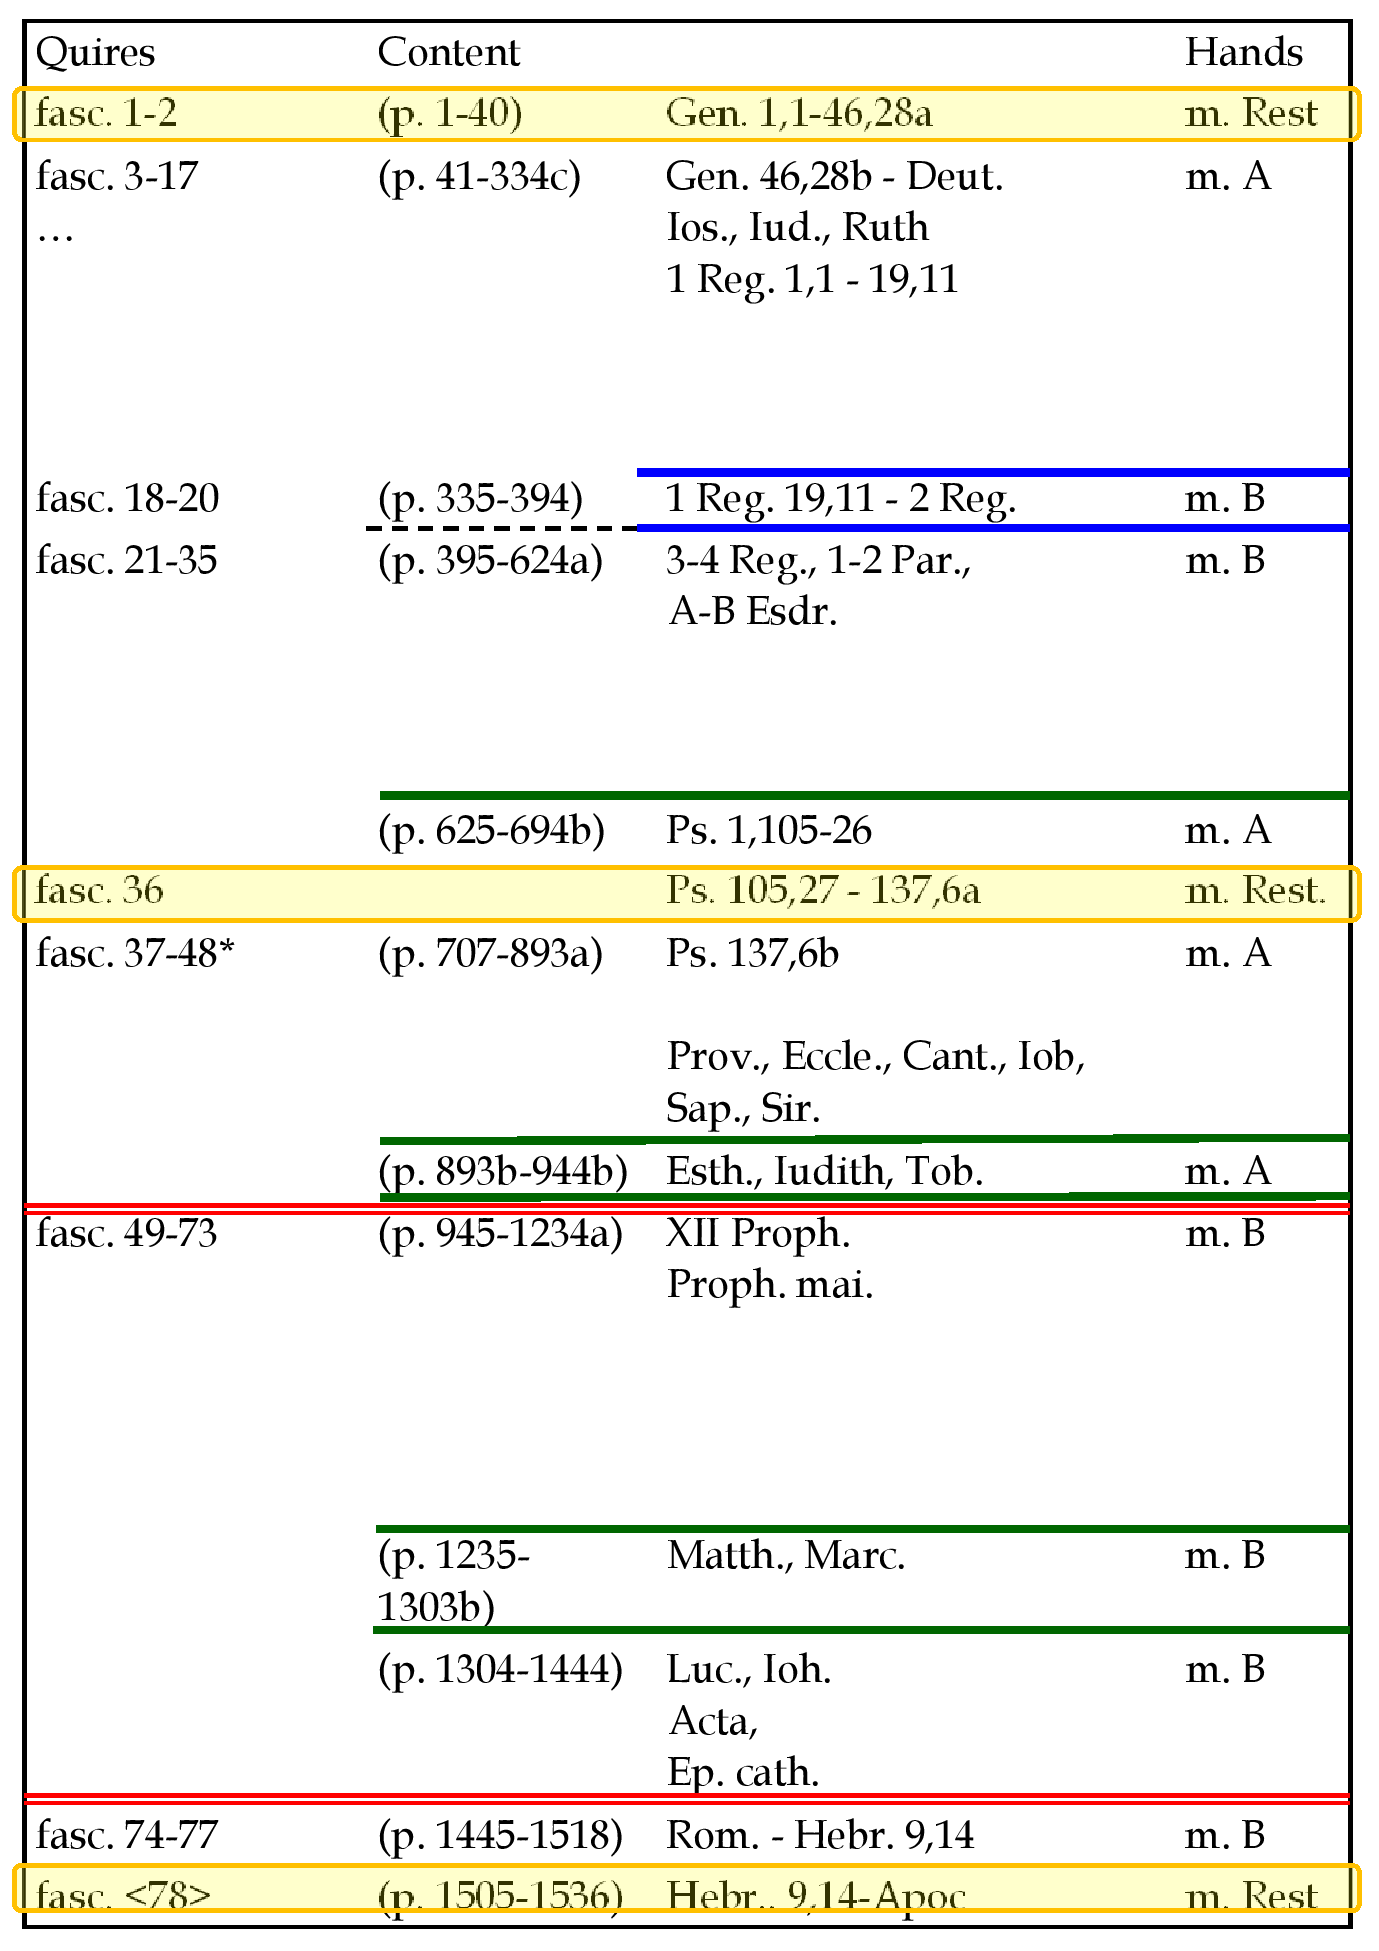
There are two other results worth mentioning: the first relates to the transition between the Old and the New Testament; it was important enough for the producers to stop an Unbroken Series at the end of Daniel, with two unusual empty columns, in order to begin Matthew on a new recto, but in the middle of the quire. It was not important to them to start the Gospel of Matthew at the beginning of a new quire. As a result, there was no possibility to bind the New Testament into a separate volume, or to insert paratexts before Matthew (such as the canon tables of Eusebius of Caesarea) without damaging a quire.
The second interesting result has to do with a similar discontinuity between Mark and Luke, which are separated with an unusual empty column. The research asks if this extra space should not be put in relation with the fact that the Vaticanus has the short ending of Mark. [16] Did the producers leave some space in order to copy a longer ending, in case the patron or a future owner wished to do so? It is not impossible, but it is also relevant to remark, on the one hand, that there is not enough space to copy the traditional longer ending and, on the other hand, that a similar unusual extra empty column is found at the end of Mark also in codex Alexandrinus [17] which has the traditional long ending. The reason for the empty space still awaits a better explanation, maybe in relation with some book producing traditions.
Today, as explained in the introduction, in spite of several progresses, no electronic description model exists that would allow for these structural layers to be shown, and much less any tool that would help in finding and defining them.
In order to describe how such a tool could work, I would like to explain how one arrives at such an understanding of the architecture of a codex in the traditional way. Methodologically, the best chances to obtain these results is by drawing a table in which the various features of the codex (and more specifically, the places where each feature changes) are set out in the columns. Then, one can analyse the concomitant discontinuities.
Let us take codex Bernensis 469 [18] as an example, because the table for codex Vaticanus would be too long for this article. In Diagram 2, each column contains information about one feature of the codex. Most importantly, it indicates where changes in the observed features are located; they are marked with a slash and an acronym: [19]
- the quires, which are the most important features for studying the architecture of any codex; [20] each quire is represented and numbered;
- the writing support, including changes in the types of paper (acronym “Mat”);
- the quire marks, including signatures and catchwords (acronym “Mq”);
- the quire types, i.e., series of quires with the same number of leaves, including the last quire, which may be shorter or longer (acronym “Ch”);
- the content, indicating where each piece of content begins and ends, and where fully or partially blank leaves are located (acronym “Ct”);
- the hands, including the scribes (if known; acronym “Mn”);
- the writing systems, for example, if all the titles are written in special characters and red ink, then suddenly they are written in normal characters and ink (acronym “Ec”);
- the ruling, in terms of its material execution (technique, system, method; acronym “Rg”);
- the layout, understood as both the grid which results from ruling (the ruling pattern), and the way it is used (acronym “Mp”).
These features constitute a significant part of the basic data about the codex and of its description.
Horizontally, the rows represent places in the codex. As a result, feature changes occurring at the same place are mentioned in the same row.
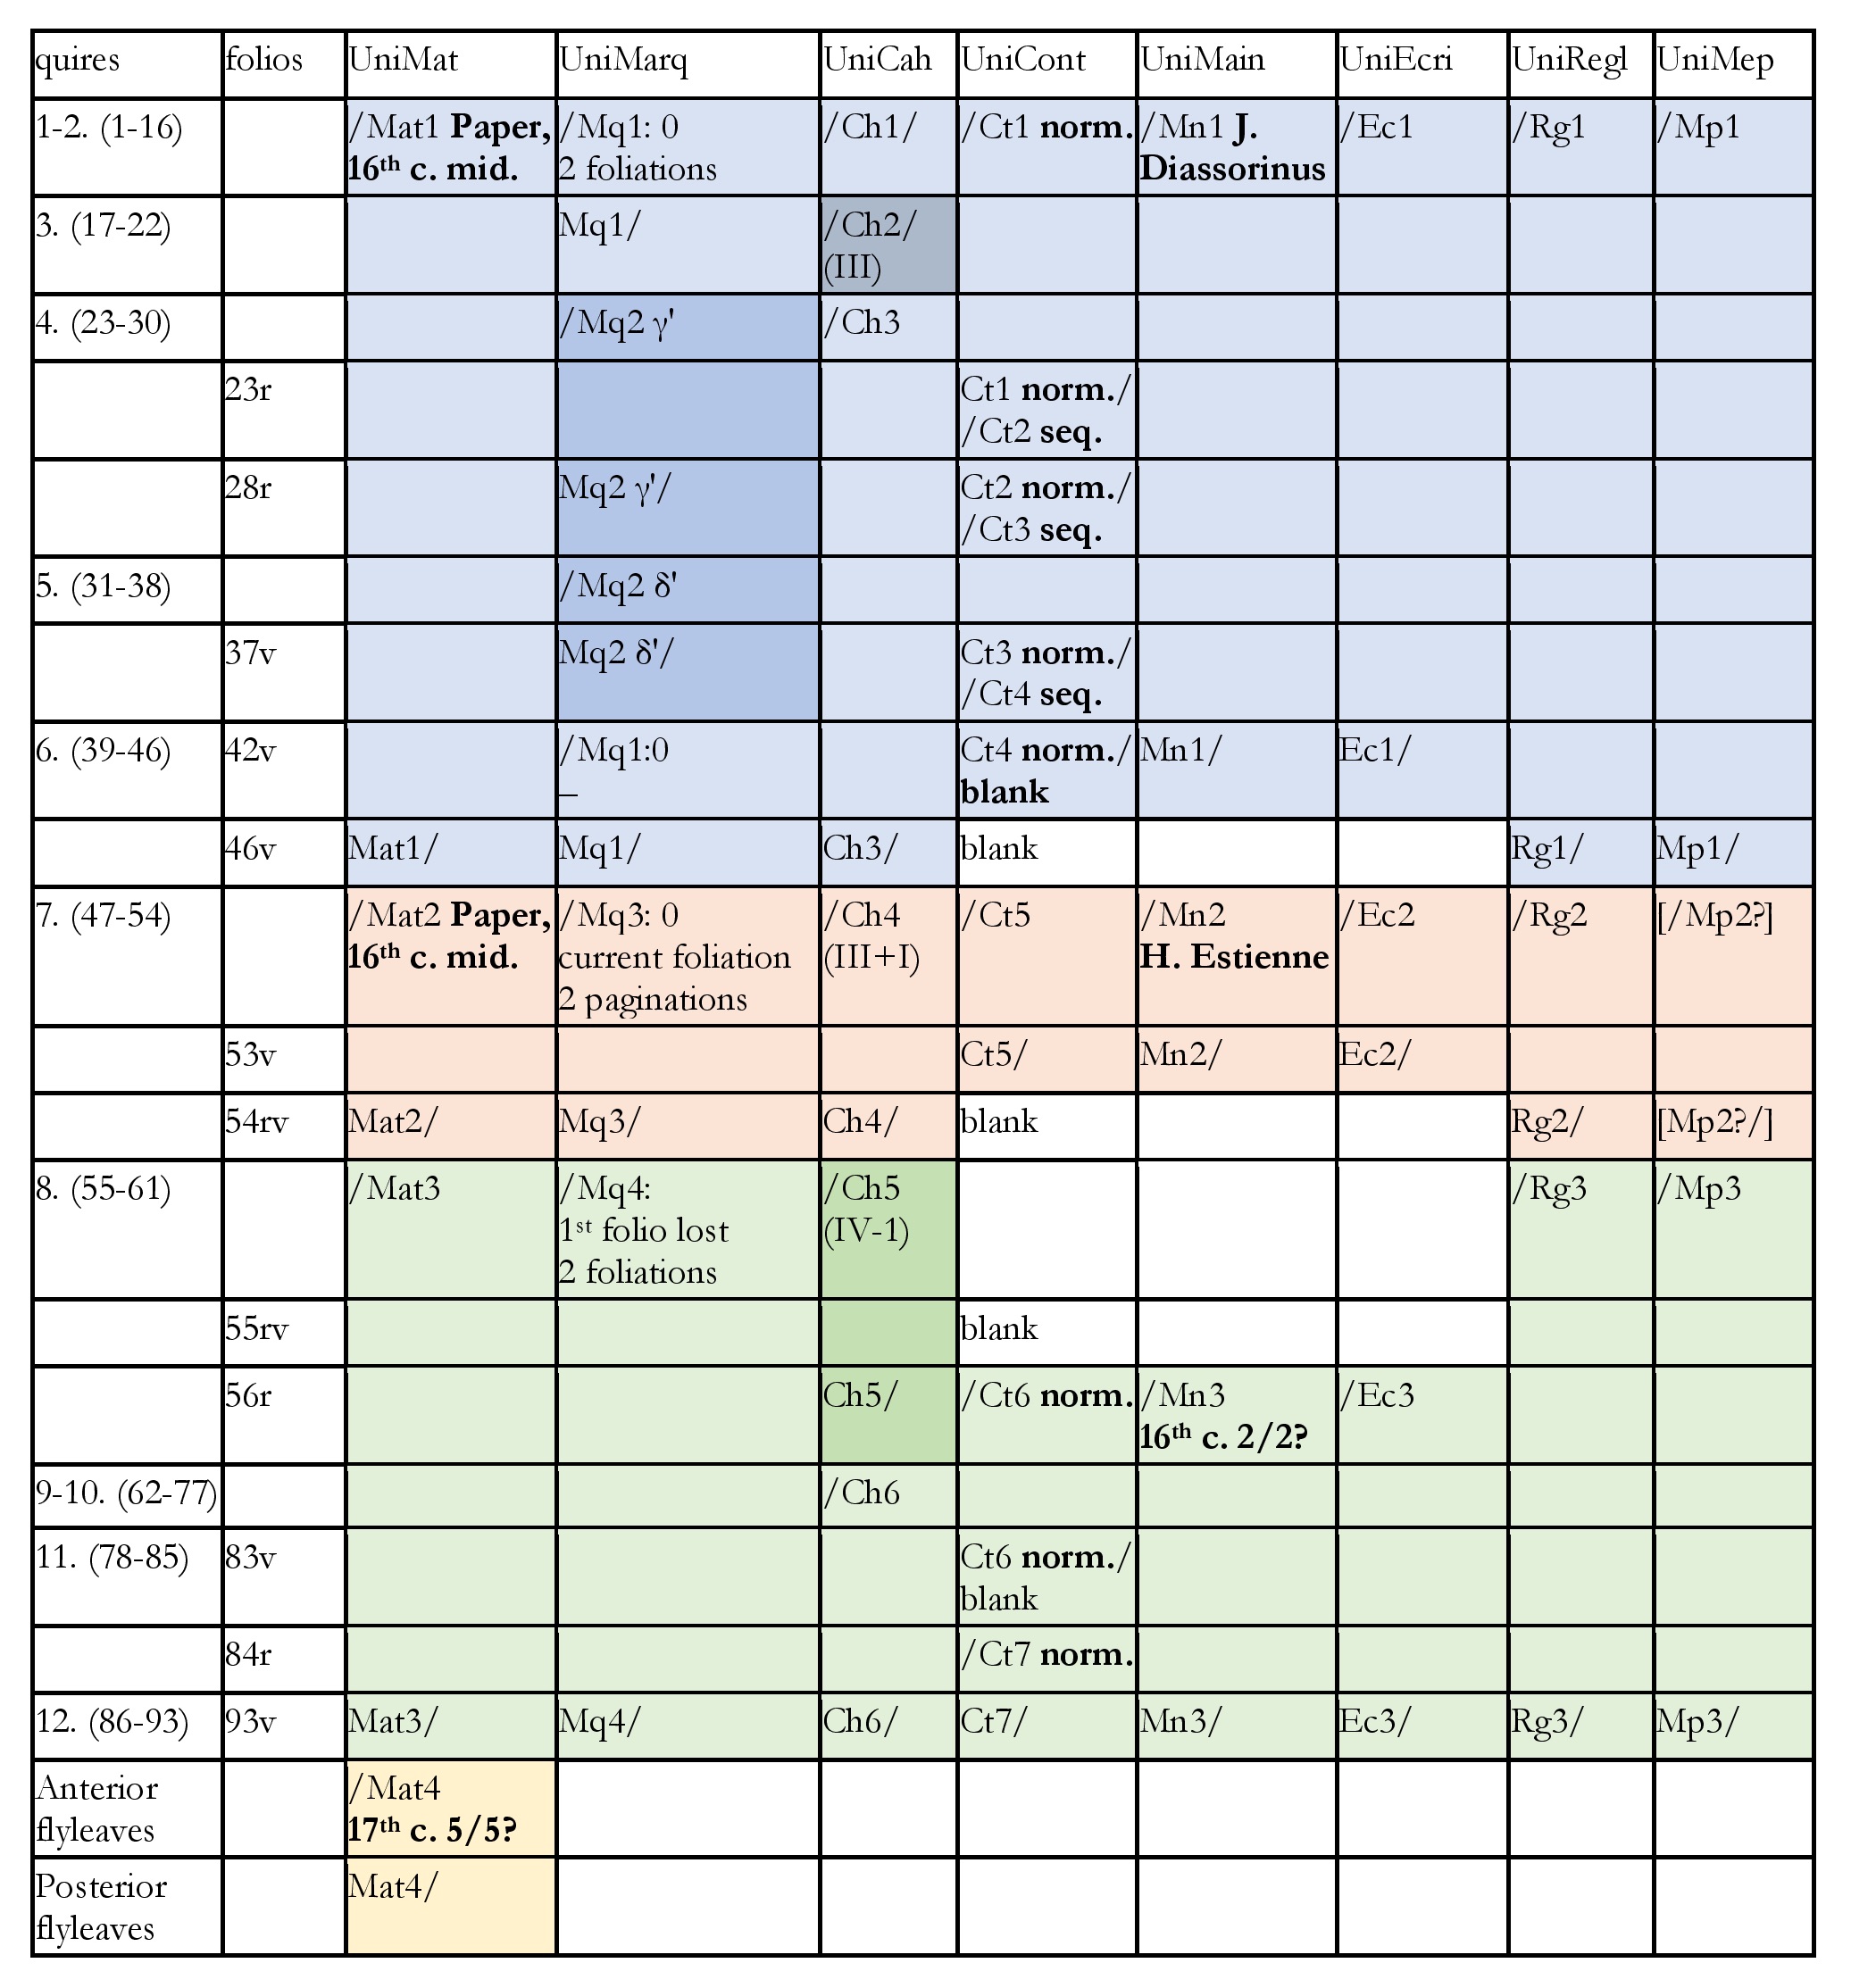
One quickly notices that all the features change between quires six and seven, as well as between quires seven and eight. Moreover, there are also some concomitant changes between quire three and four. It is important to note that the table does not directly show the architectural layers, but it points to where one ought to look for the relevant discontinuities between the layers, ideally directly in the codex. In this case, we find that Bern. 469 is made of three parts, which previously circulated separately from each other.
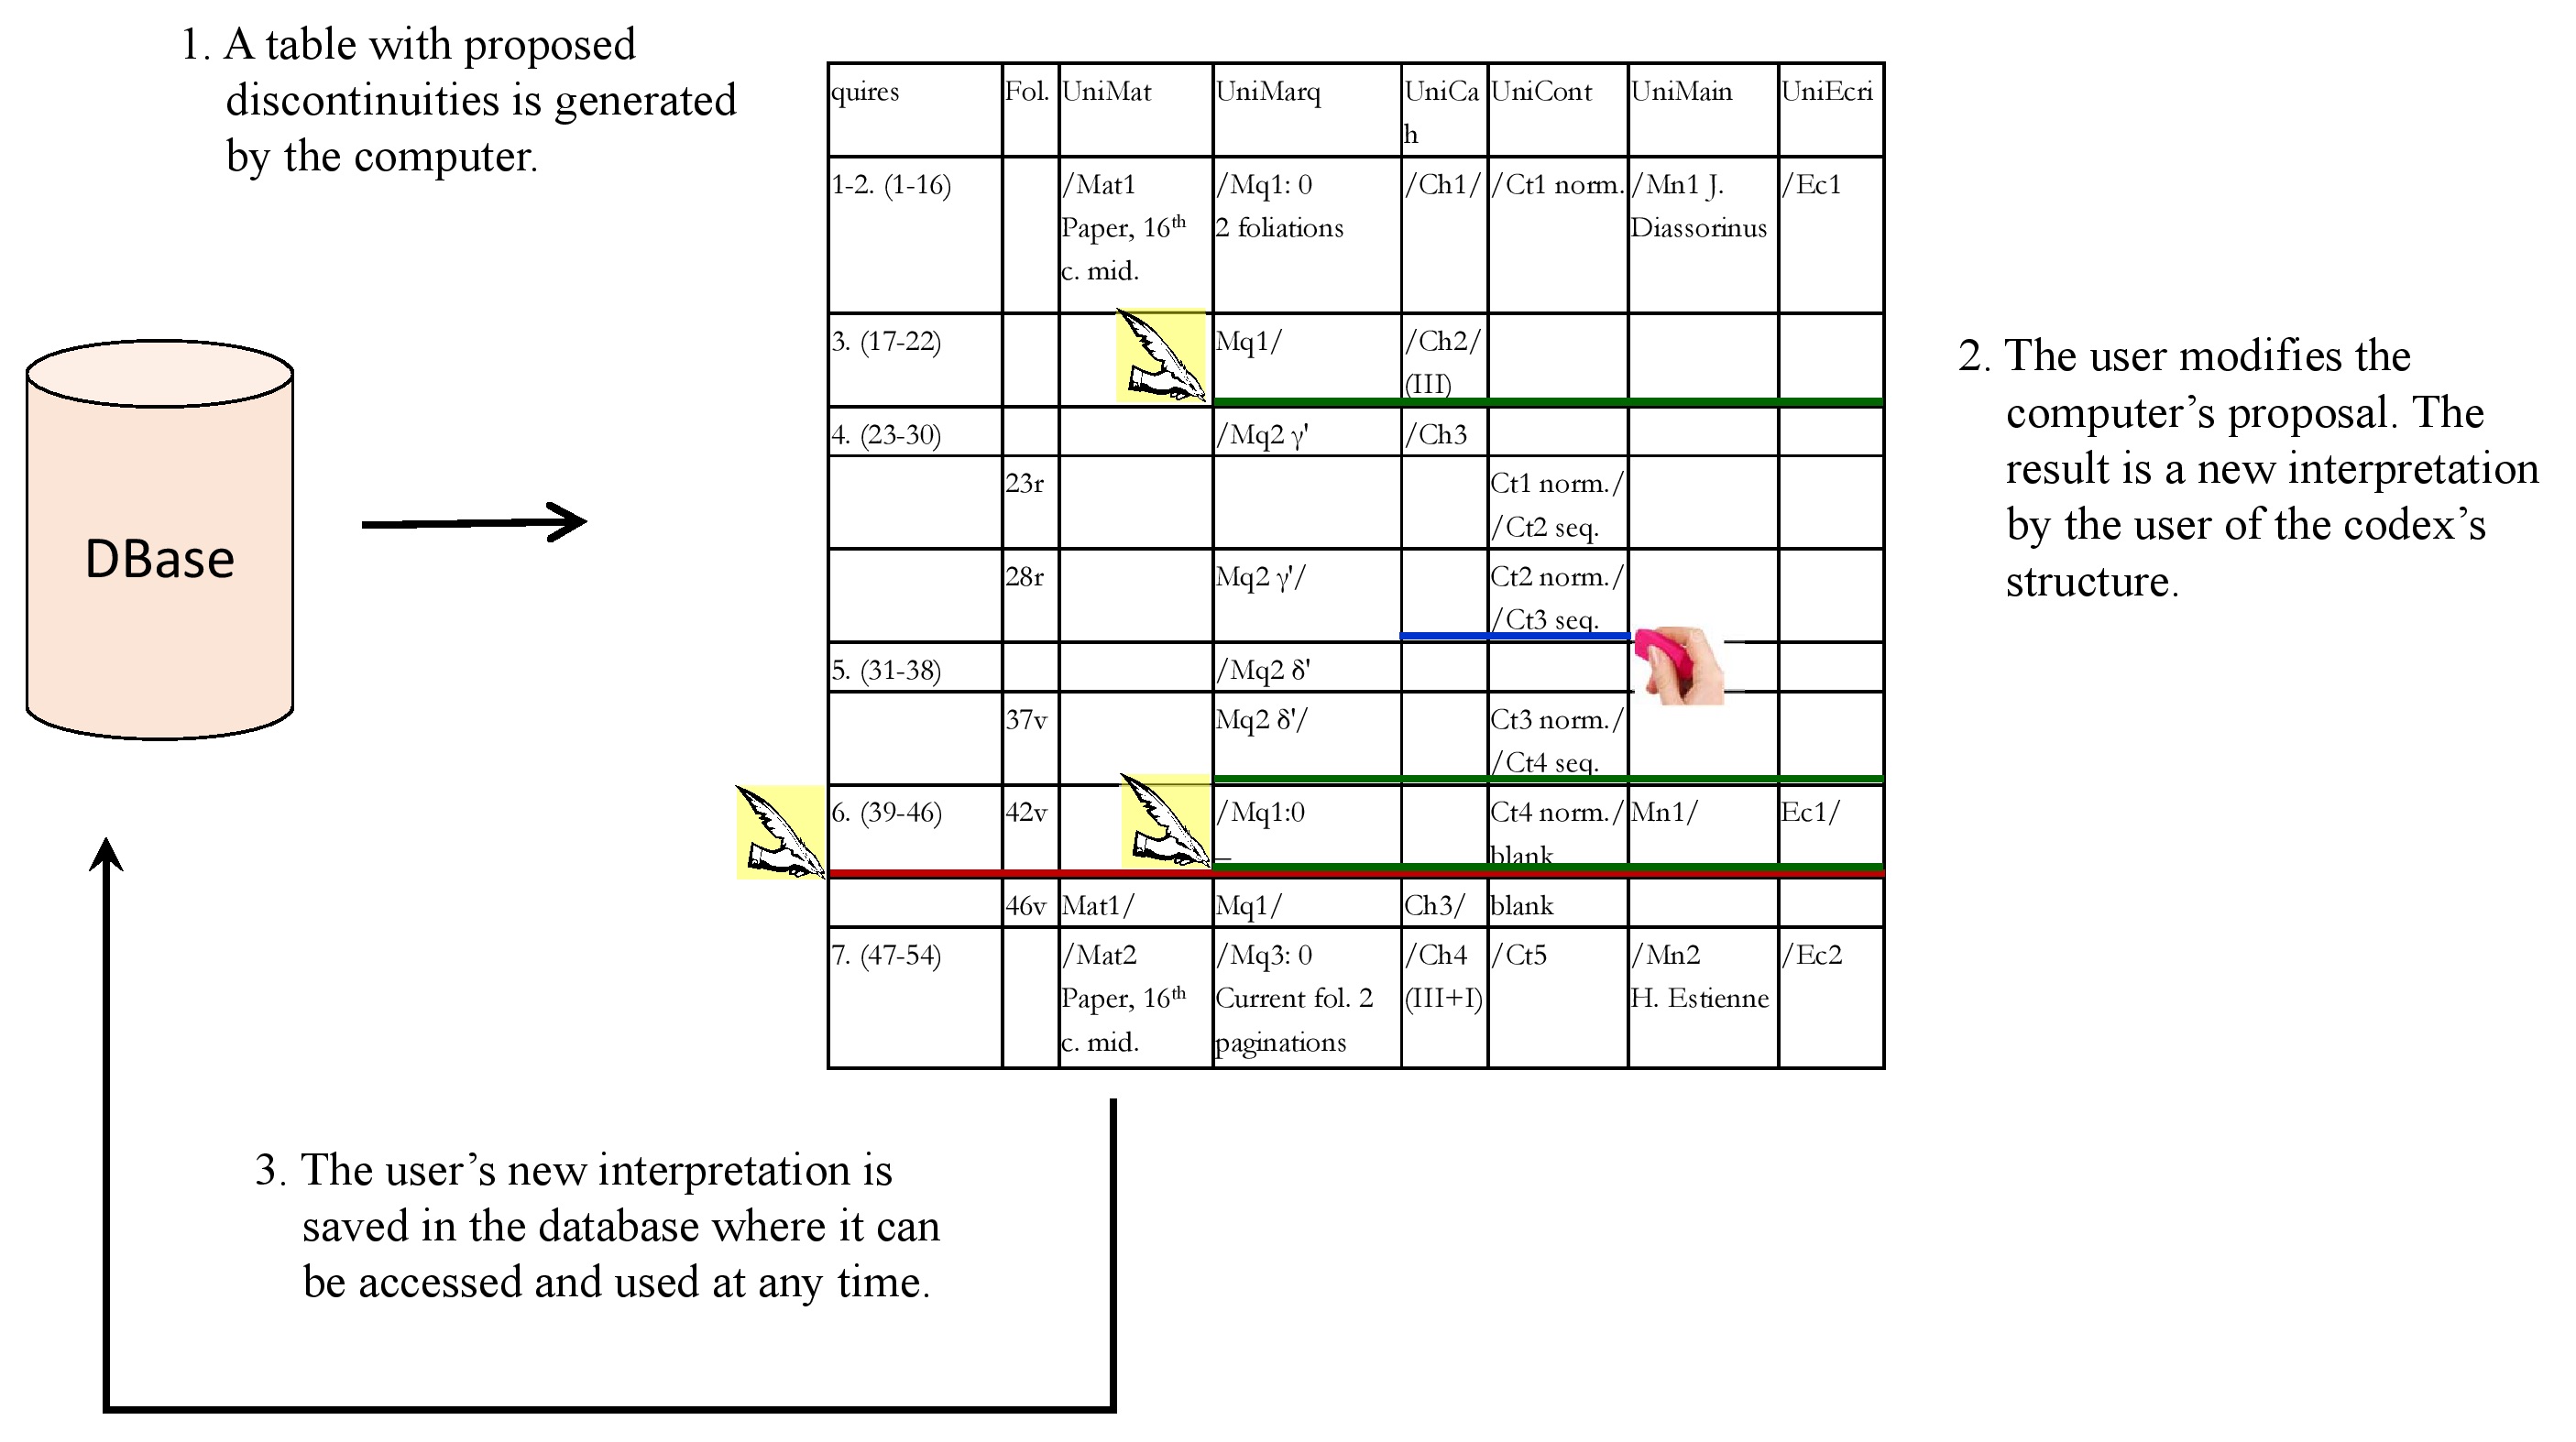
Preparing such a table by hand is a lot of work. But drawing a table and finding concomitant discontinuities, this is exactly the kind of thing a computer is very good at, provided it can access the relevant information.
I envision a process in three steps:
1. the system generates the table and automatically suggests where codicologically significant discontinuities might be located.
Having the computer draw up such a table implies that quires and folios are described precisely and correctly because the computer should be able to recognise, for example, that a new quire begins exactly at the same place where a new text was copied by a new hand, etc. [21]
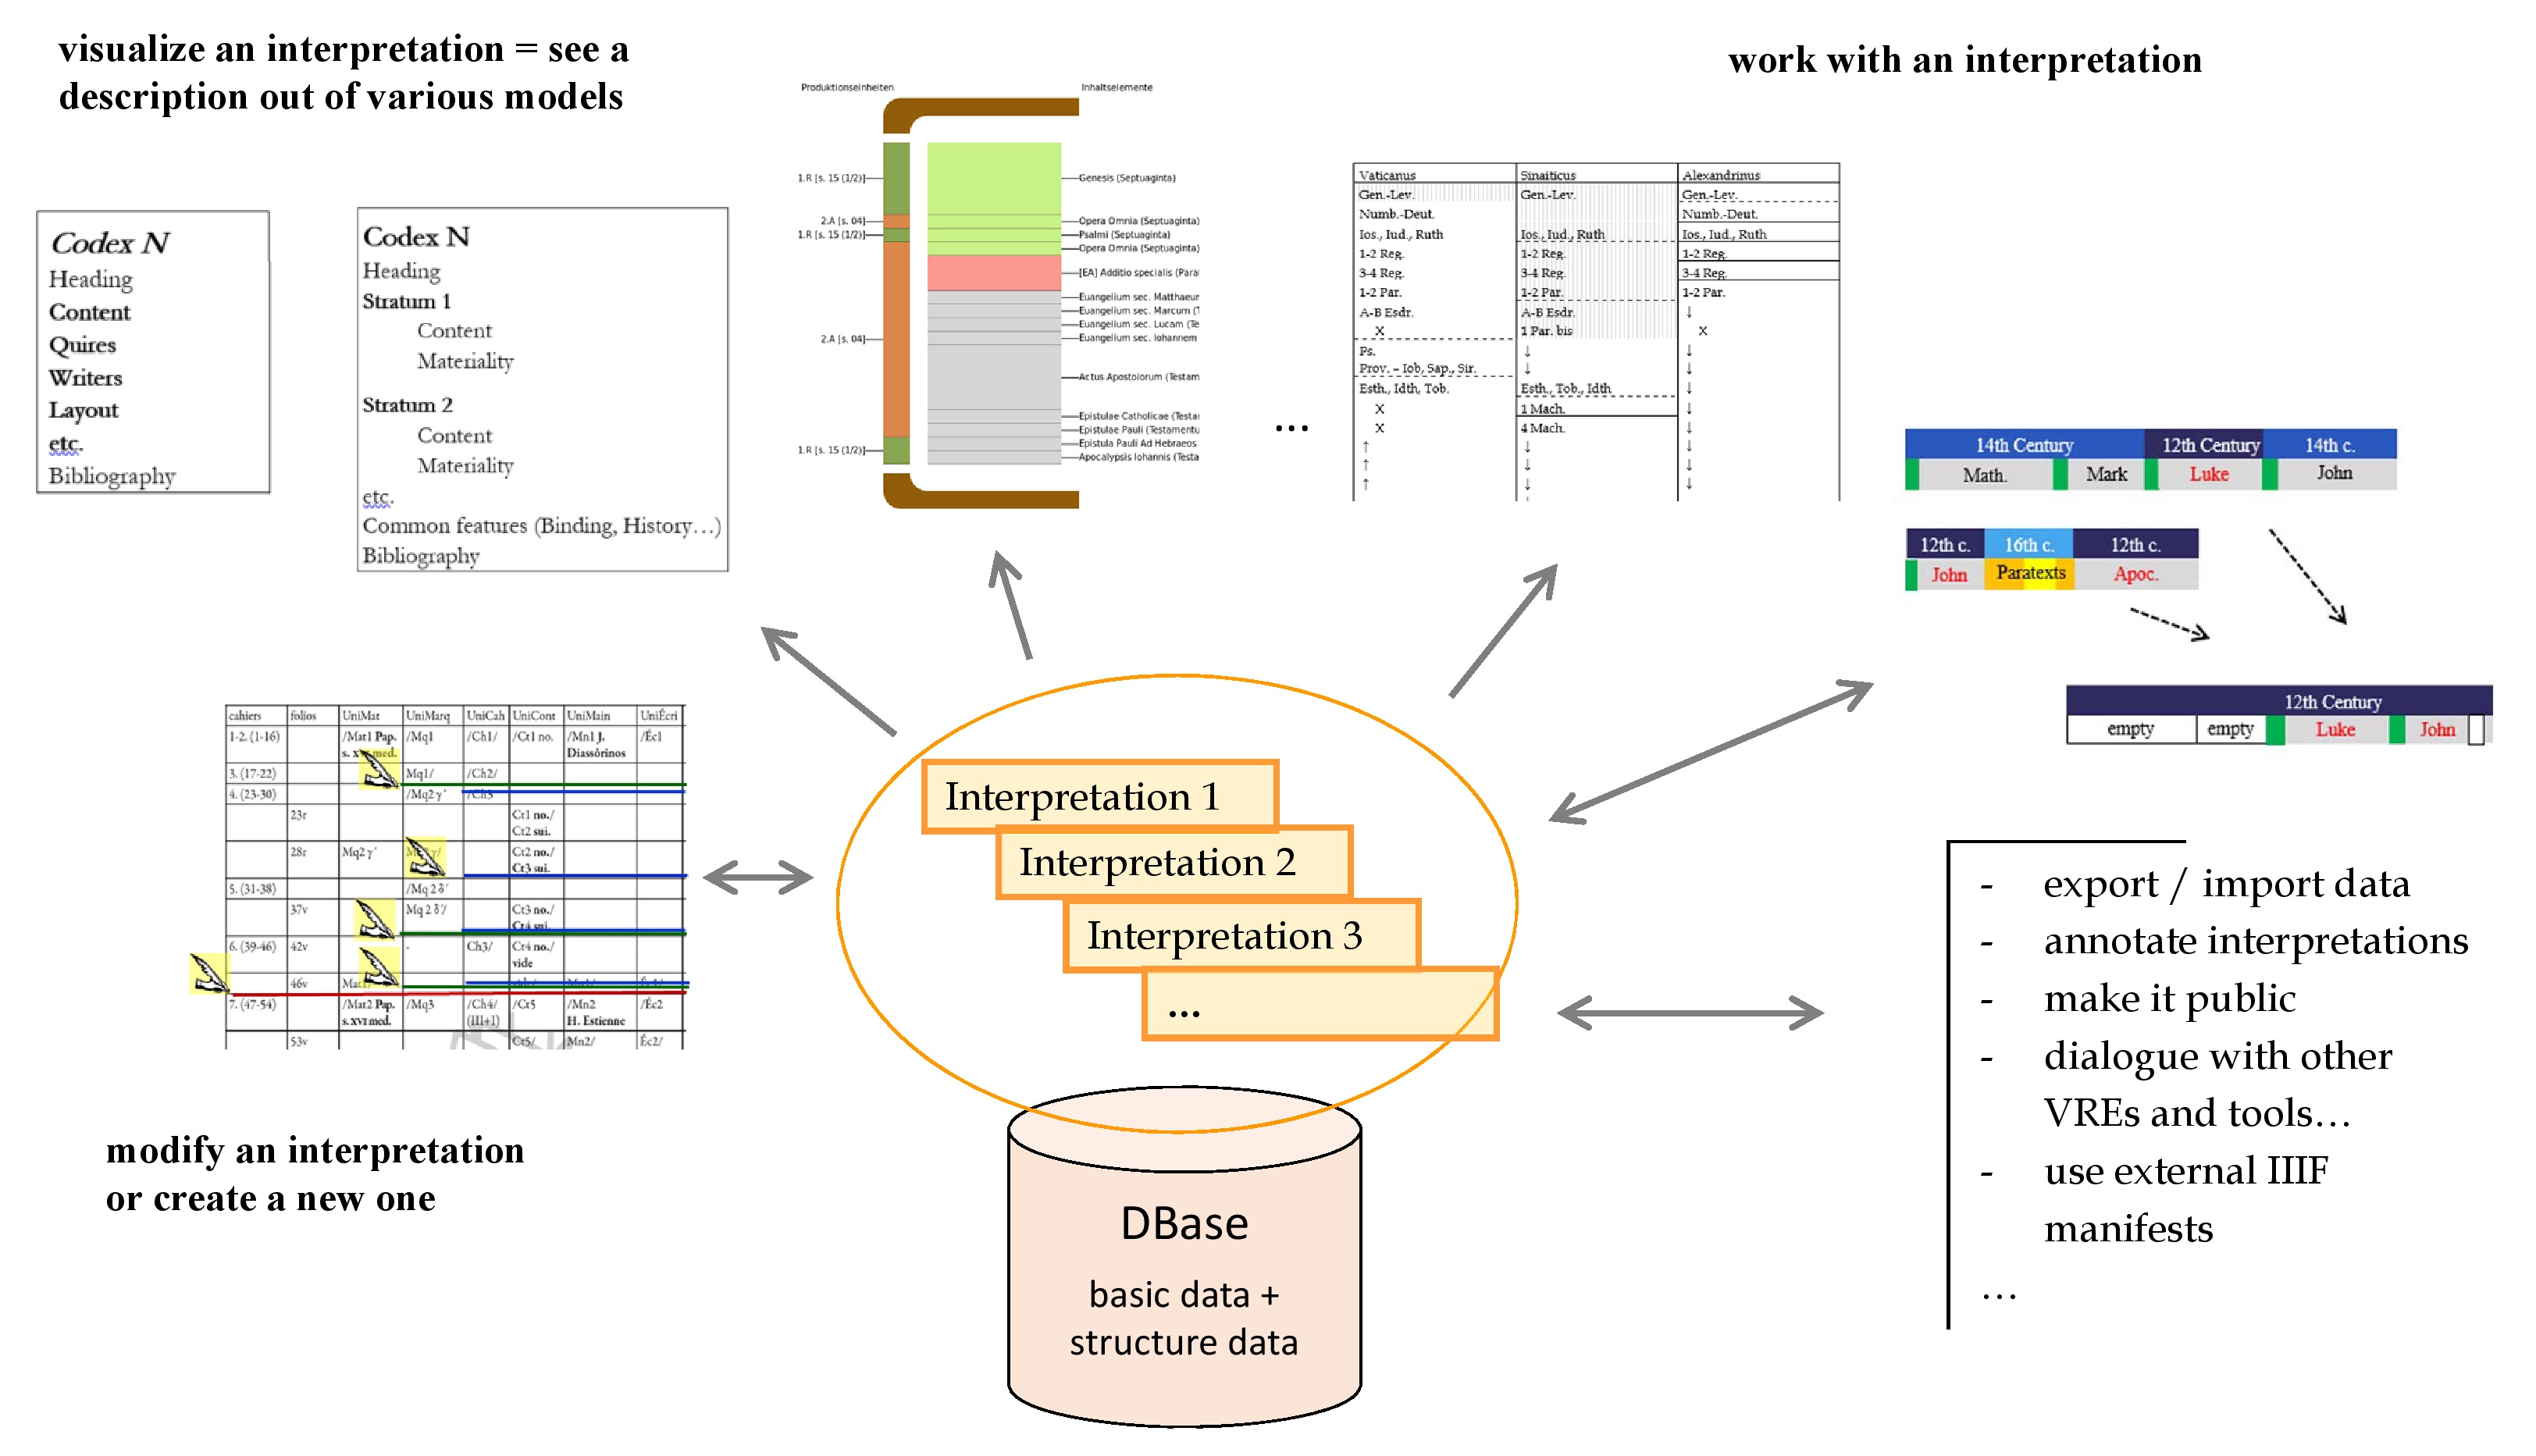
2. Users should have the possibility to modify the computer’s suggestions, until they are satisfied with the result. This result is what can be called one analysis or one interpretation of the architecture of the codex, and it can form the basis of a description.
3. Once the user is satisfied, the next step is to give them the possibility to save their interpretation in the database. The idea is not to replace the original standard interpretation by the cataloguer, but that each user should be able to save as many interpretations of the same codex as they wish, in addition to the standard one.
Additionally, the user should be able to display, use, publish or privately share the data according to any of their saved interpretations, or to the standard interpretation, as they wish.
Users would be able to “activate” one interpretation and see the new structure within the already existing description models (at least in the models that are able to show something of the structure of a codex); this also requires the creation of new models, in which all the discontinuities and all the layers can be visualised.
It also implies that structure-sensitive searches (for example, when there are dates involved) take the “active” interpretation into account instead of the standard one.
As a result, the process of visualising a description (or “using” the codex in any number of other ways) always occurs through the “lens” of a specific interpretation whether this be the “standard” one issued by the cataloguer or a new one developed by the user.
Thesis 2
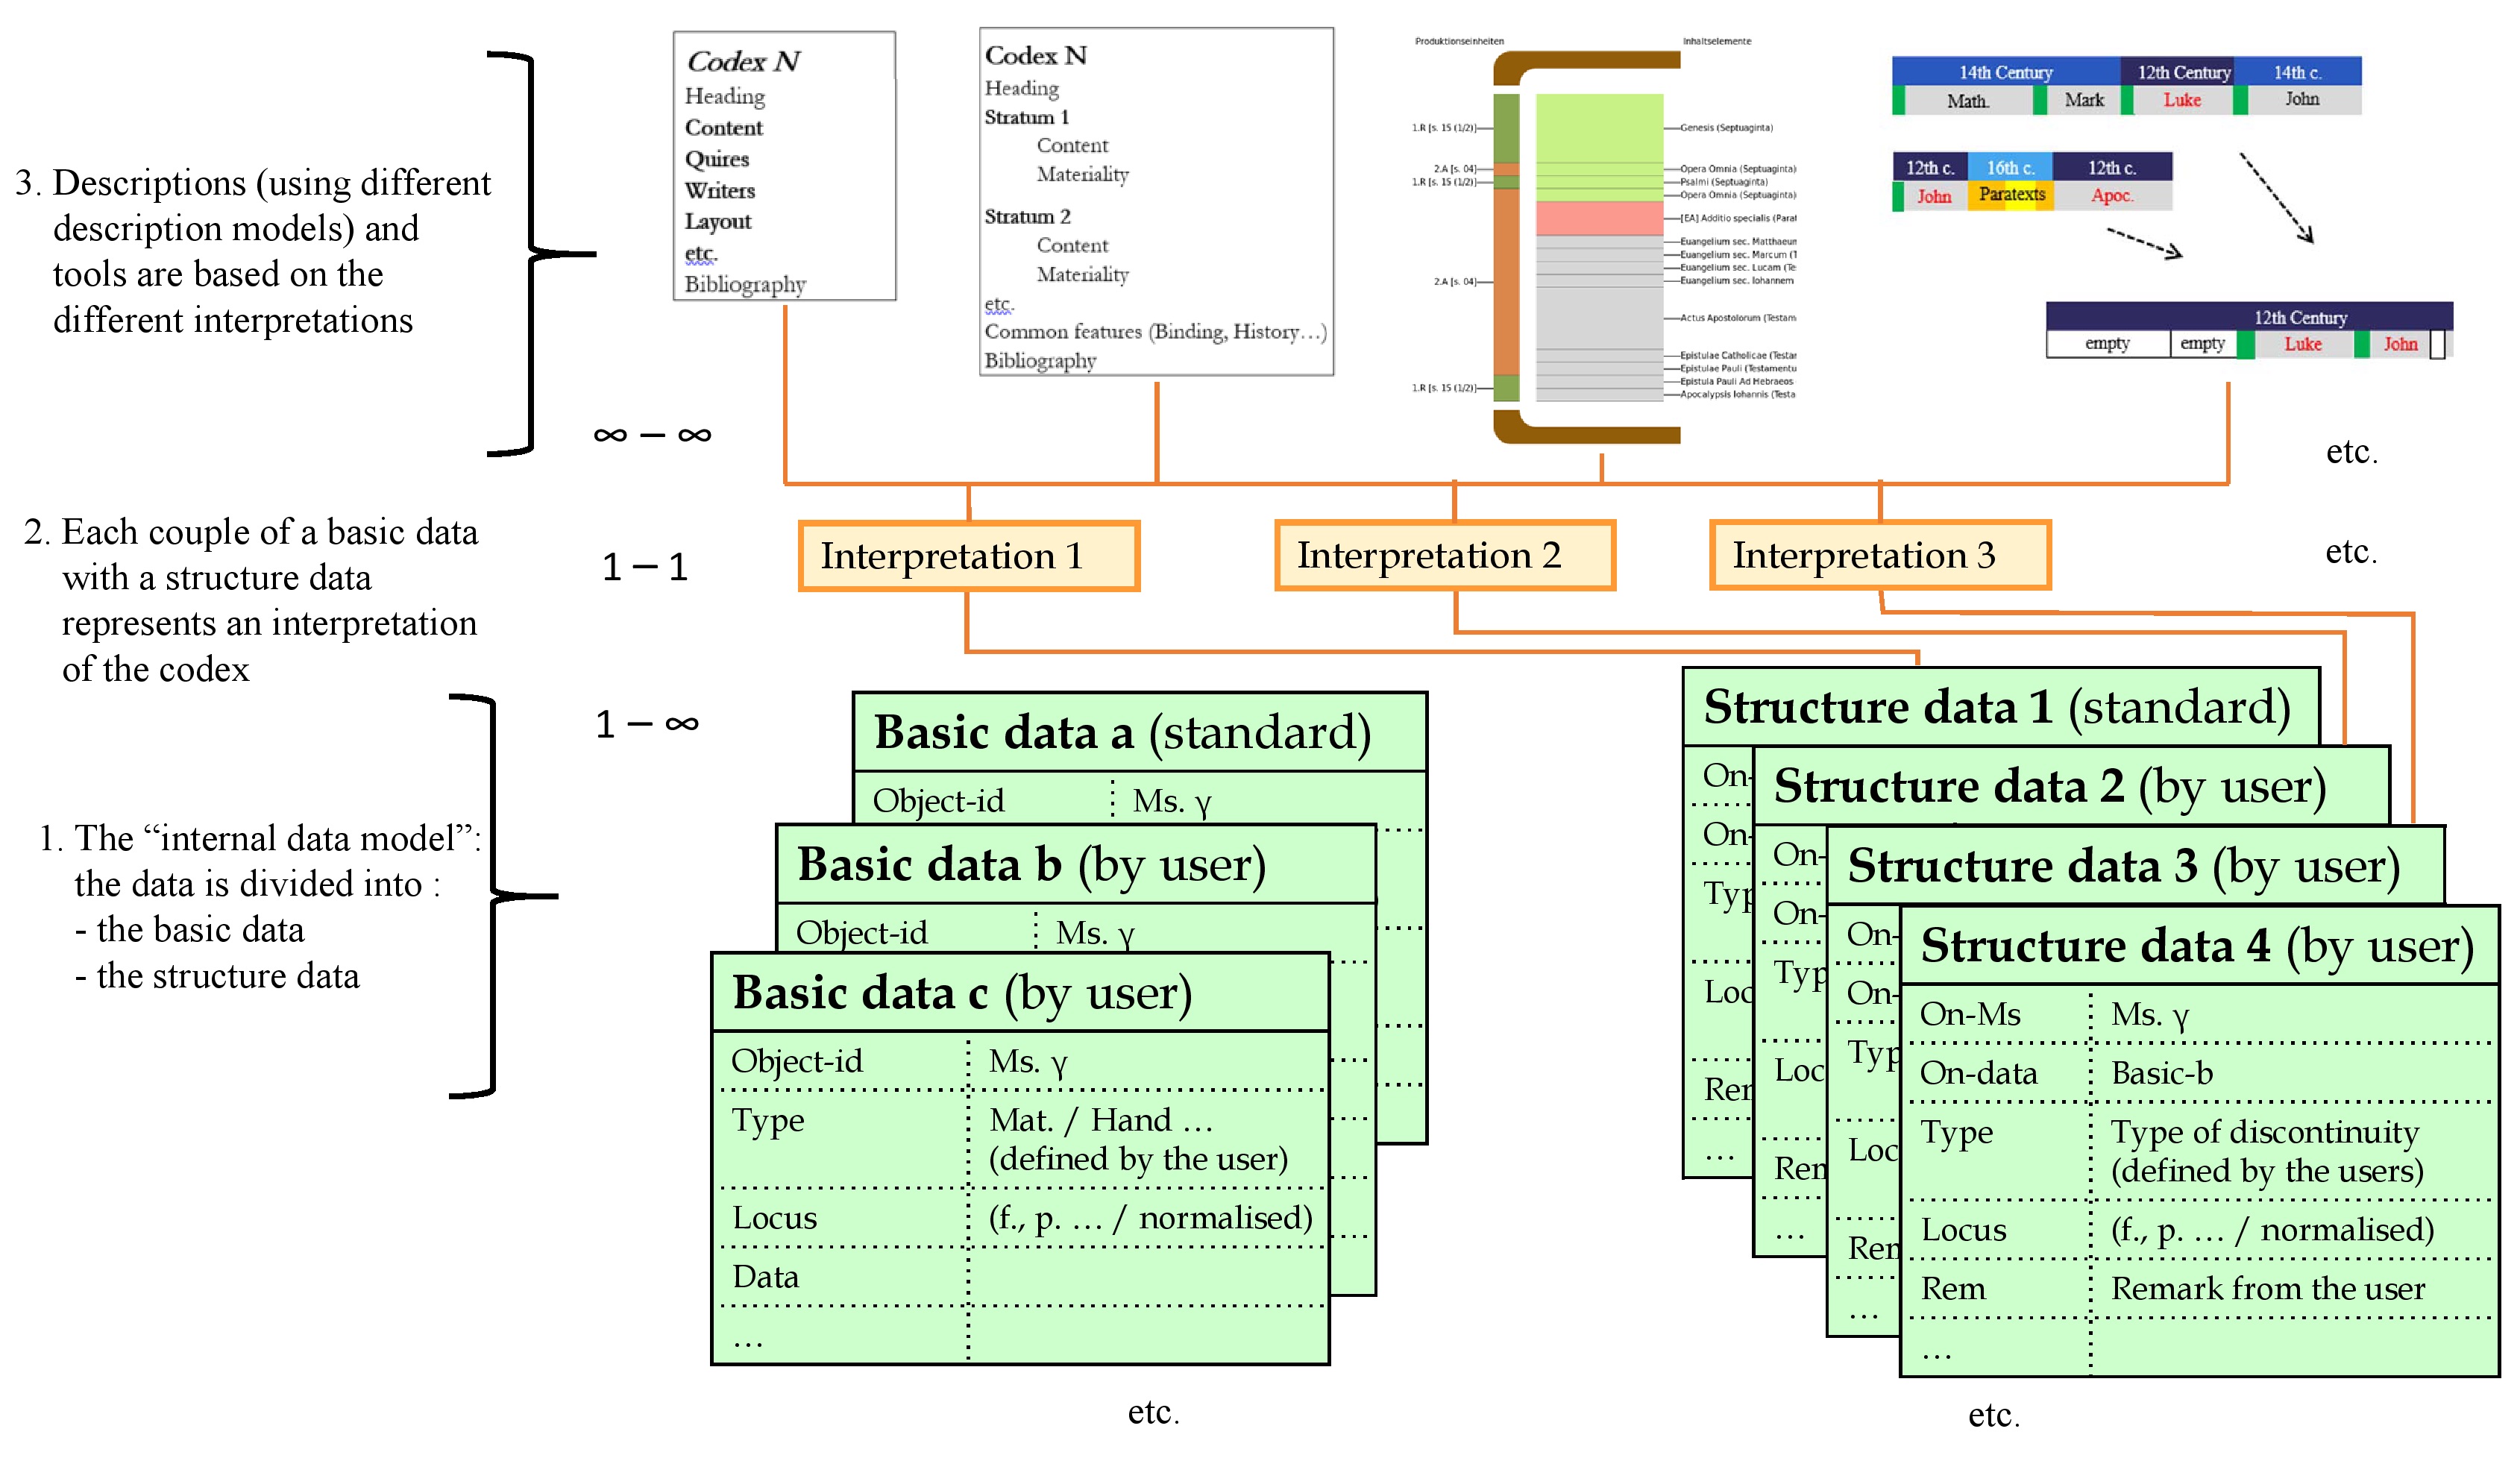
To facilitate these goals, the internal data model should be structured in two separate classes of data: on one side, the data which concerns the structure of a codex (the structure data) and, on the other side, the data describing the various features of that codex (the basic data; see Diagram 6).
Only when a user requests to visualise or use a description, are both sets of data joined in order to present the manuscript in a structured way. As a result, the users can be given the possibility to organise the description in various ways, potentially very different from the one of the cataloguer, to save their new perspective—i.e. to record a new set of structure data internally for the same manuscript without altering its internal basic data—then display the data, or use it, according to any recorded perspective.
As explained above, in these databases, the structure data (provided by the cataloguer or the user) act as a necessary lens between the internal basic data and the way this data is visualised and used. Thanks to these structure data, users can present their own vision of a manuscript and save it for later use and possible revision.
Thesis 3
Moreover, the data model must allow for each user to create, save, and use many sets of structure data for the same set of basic data. We will return to this point below (see § 6 and the Diagram 6).
4. A Tool to Compare Manuscripts
A first example of a tool our group discussed, though briefly, would help compare the content and the main structure levels of several codices. We take as our example here the Old Testament portions of three well-known biblical pandects, with an explanation of the diagram following:

The diagram presents the (main) pieces of content of each codex in the order they appear. The first particular feature of this diagram’s tabular presentation is that it shows whether a piece of content can be found in the other codices or not (marked with a cross « X »), and, if so, whether it is at the same relative position or elsewhere in the codex (marked with an arrow « ↓ », « ↑ » pointing to where it can be found).
The second particular feature consists of showing the possible physical discontinuities of each codex according to a given interpretation. In this case, it shows my interpretation of possible volume breaks (triple lines) as well as modular units (single lines) and unbroken series (dotted lines). Naturally, such a tool would be particularly interesting for any type of manuscripts containing the same series of texts, and not just for codicologists working on biblical pandects; one can think, for example, of manuscripts of Plato, or medieval fabliaux.
Again, it took a lot of time to prepare this diagram by hand, but it could have been done much more efficiently and precisely (and possibly interactively) if prepared by a computer using a database.
5. A Tool for the Graphic Reconstruction of a Manuscript
As another example of the possible uses of saved interpretations, our working group supported the idea, already mentioned among the objectives of the StruViMan project (see below), of a tool that would make it possible for a user to establish a graphic reconstruction of a lost manuscript, or of previous stages of a preserved manuscript.
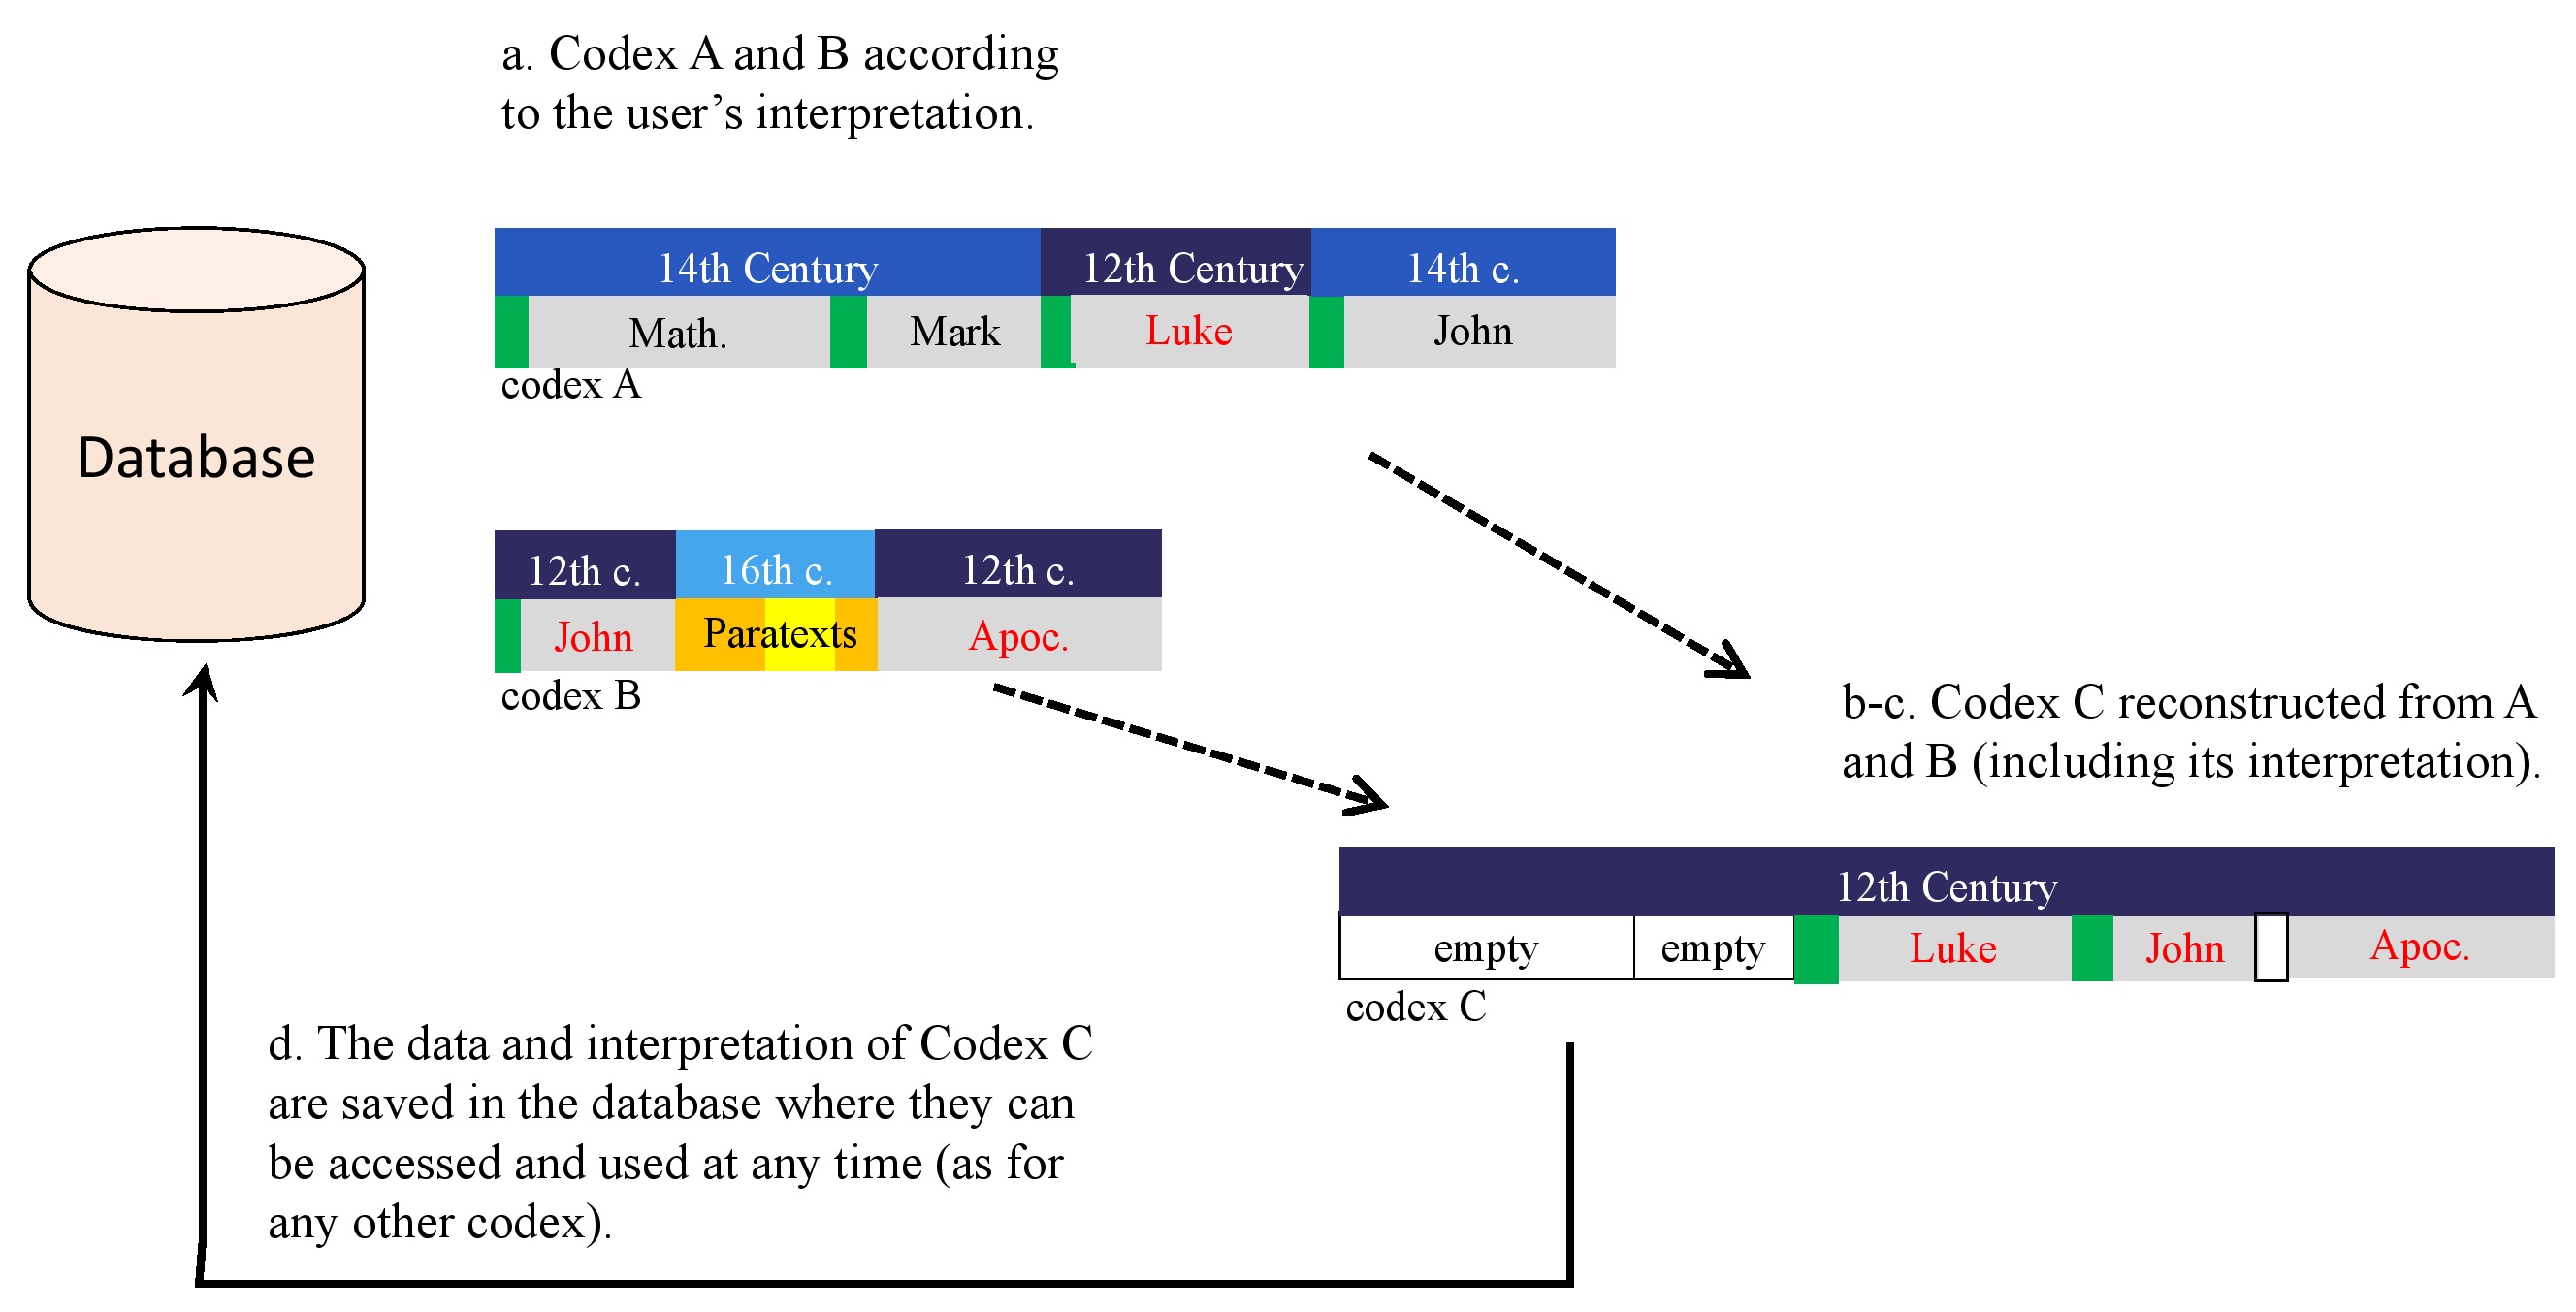
As an example, let us think of two current codices (see diagram 5 below):
- codex A, which, according to a given user’s interpretation, is made of three parts: one part containing the Gospels of Matthew and Mark and produced in the 14th cent.; the second part containing the Gospel of Luke and produced in the 12th cent.; the third part, containing the Gospel of John, also copied in the 14th cent. by the same hand and in the same layout as part 1. The user thus identifies two UniProds:
– UniProd 1: a production of the 14th. cent. (= part 1 + 3 = Matthew, Mark and John).
– UniProd 2: a production of the 12th cent. (part 2 = Luke);
- codex B, in which the same user also identifies three parts which can be analysed as two UniProds:
– UniProd 1: a production of the 12th cent. (= part 1 + 3), containing John and the Apocalypse; they are by the same hand in the same layout as UniProd 2 of codex A.
– UniProd 2: a production of the 16th cent., containing various paratexts to Apocalypse.
In this example, the user could reasonably think that UniProd 2 of codex A and UniProd 1 of codex B were originally produced together and were also part of the same original codex. The tool that I envision would then make them able:
- to display both codices according to a description model in which the main parts of the codex and their main features are represented graphically;
- to “create” an empty new codex C within the graphic environment;
- to drag and drop the 12th cent. parts of Codex A and B into codex C (thus creating a hypothetical reconstruction of a codex) and to assign the empty spaces within codex C to whatever other content they may think was also part of it (and annotate these spaces if they wish). In this example, it could be two empty spaces at the beginning of C for the lost Gospels of Matthew and Mark;
- to save the reconstructed codex in the database (basic and structure data) and use it like any other codex, including the possibility to modify it or define various interpretations.
Needless to say, the tool would not be limited to working with two manuscripts: theoretically, any number of manuscripts (including a single one, for exploring other possible stages of development in a codex’s history) could be used as a “source” for the reconstructed codex.
As far as the graphic visualisation of a codex is concerned, it is worth mentioning the tool called StruViMan, which is being developed at the LMU University of Munich with the specific purpose of both visually relaying the various UniProds of a codex on a single screen, as well as each of their respective contents. StruViMan generates a graphic representation on demand, on the basis of an underlying database description. [22]
6. Further Remarks on the Data Model
As my “theses” above have underlined, the flexibility needed to build such tools implies not only that the data model should be disconnected from the description model, but also that there is a need to develop a new data model in which the data for a manuscript falls into two categories:
- The basic data—the raw data, if you will—recording the plain facts about the manuscript; for example, this text begins on f. 20r and ends on f. 60v, the first scribe is Ephrem and he worked from f. 1r until f. 51r etc.
I speak here of descriptive data, which should be as objective, precise and complete as possible, even though ultimately any recording of data about a manuscript or any description is always interpretative to some extent. [23]
- The structure data, through which users can visualise their own interpretation of the basic data, according to their understanding of the historical layers and the production discontinuities of the codex.
As seen above, there is a one-to-many relation between a set of basic data and a potentially large number of corresponding sets of structure data, since (as we have said) every user should be able to create and save as many interpretations as they wish using the same basic data. Incidentally, an interpretation of a codex can thus be seen as the single result of a specific relation between a set of basic data and a set of structure data.
But let us take it one step further. As I just mentioned, basic data is always interpretative to some extent. We can now add that describing a codex is always a work in progress. There are times when a user has more and better information than the initial cataloguer, and there are other times when the user does not agree with the data given by the cataloguer, for example if they do not recognise the same scribe, do not agree on the dating, or read a detail differently.
Since my vision is built on giving the users as much flexibility as possible, it naturally leads to a further thesis:
Thesis 4
The new data model must also allow each user to be able to enter their own basic data, as a complement or correction to the standard data (or any public data), but without replacing it, and to save, use and share their basic data if they wish.
The following diagram summarises the overall data model according to my fourth thesis:
Concluding Remarks
Instead of a conclusion, I would like to briefly address three questions among the many that this essay leaves open. Firstly, as the reader may have noticed, this article does not make any recommendation about what kind of underlying database technology should be used. Should it be an XML/TEI database? A relational one? An RDF technology? Or should one try to mix the technologies, for example relational database with XML/TEI tolerant fields?
Our working group concluded that, from a strictly technical point of view, it is probably possible to build the tools based on any of these database systems, but the cost for building the tools, then using them efficiently, will not be the same. This is why we advocated a “scientific” approach or research-based approach towards finding the most appropriate technology: testing possible data model solutions on small-scale databases; considering other aspects such as the speed and potential of errors when inputting data, or the ease of sharing data and communicating them to other computers and so forth. An informed decision can then be made on the basis of these observations.
Secondly, how realistic is it to think these tools can be built? My answer considers only some aspects. The tools can only be created in the framework of a larger project with a secure source of funding. But they do not need to be created all at once. As we have seen, the tools to compare and reconstruct manuscripts are built on the tool that analyzes their architecture. Thus, the first step would be to set up a database according to the new principles and create this last tool, then the other tools, one after the other. The projects currently being planned at the LMU University of Munich represent a good opportunity to realize this first step.
The data model is new, but the data does not need to be new or newly inputted. Many descriptions in existing databases, based on standard description models, already contain the required data; and descriptions based on structured models not only contain basic data, but also information about the structure of the codex. Above all, it is a matter of being able to convert the data, if not permanently for a complete database, then at least temporarily for the data required for a given tool. Since computers are usually good at converting data when correctly programmed, this step seems also achievable.
Furthermore, once they are up and running, these tools do not need to remain at the local level. As a long-term goal and further step in the development, these tools (and other tools that could be developed by other people or in order to address other needs) could be integrated into a public Virtual Research Environment that could be used by any service or database, providing they can send their data in an interpretable format. The development of this VRE would be the main goal once the two first steps have been completed. But it might require a new project or a joint effort between various projects.
Overall the integrated database and tool might look like the following diagram:
Finally, let us remember that, no matter which cutting-edge new models and software are developed, the main challenge in any manuscript database is a human one, which will not disappear any time soon: there is only so much one can do with subpar extant data. As is to be expected, it’s a database, not an alchemical process that turns leaden data into golden ones. The maxim GIGO always applies: some might think this means “Garbage in – Gospel out.” But in reality, as you know, it means “Garbage in – Garbage out.”
This is why our efforts should not be concentrated only towards developing new software and electronic tools, but also into teaching, researching, critical reading, exchanging and tirelessly studying the manuscripts.
Having worked extensively with databases in the past, I am certainly not unfamiliar with the logistical and structural challenges involved in getting a project like this off the ground. Nevertheless, I am convinced this is achievable within a reasonable time span. Finally, I also hope this paper was enough to communicate my enthusiasm for what could be a big step forward into making manuscript databases active instruments, that are even more useful to the humanities.
Works Cited
(All the links mentioned below were accessed on June 2021.)
Andrist, P., P. Canart, and M. Maniaci. 2013. La syntaxe du codex. Essai de codicologie structurale. Bibliologia 34. Turnhout. – Revised and expanded second edition in English to be published by Brepols in 2021.
Andrist, P. 2010. “La description des manuscrits médiévaux sur Internet: un regard critique.” In La descrizione dei manoscritti: esperienze a confronto, ed. E. Crisci, M. Maniaci, and P. Orsini, 19–45. Studi e ricerche del Dipartimento di Filologia e Storia 1. Cassino. https://www.academia.edu/5777745/La_description_des_manuscrits_m%C3%A9di%C3%A9vaux_sur_Internet_un_regard_critique.
———. 2014. “Going online is not enough! … Electronic descriptions of ancient manuscripts, and the needs of manuscript studies.” In Analysis of Ancient and Medieval Texts and Manuscripts: Digital Approaches, ed. T. Andrews and C. Macé, 309–334. Lectio, Studies in the Transmission of Texts & Ideas 1. Turnhout. https://www.academia.edu/36743101/Going_Online_is_not_Enough_Electronic_Descriptions_of_Ancient_Manuscripts_and_the_Needs_of_Manuscript_Studies.
———. 2015a. “Syntactical description of manuscripts.” In Bausi et al. 2015:511–520. https://www.academia.edu/36743036/Syntactical_description_of_manuscripts.
———. 2015b. “The physical description.” In Bausi and al. 2015:521–530. https://www.academia.edu/36743023/The_physical_description.
———. 2016. Les codex grecs adversus iudaeos conservés à la Bibliothèque vaticane (s. xi–xvi): Essai méthodologique pour une étude des livres manuscrits thématiques. Studi e Testi 502. Vatican City.
———. 2019. “Concepts and Vocabulary for the Analysis of Thematic Codices: The Example of Greek Adversus Iudaeos Books.” In The Emergence of Multiple-Text Manuscripts (= Studies in Manuscript Cultures 17), ed. A. Bausi, M. Friedrich, and M. Maniaci, 305–345. Berlin.
———. 2020a. “Toward a New Generation of Databases and Database Applications for Describing Ancient Manuscripts.” Digital Scholarship in the Humanities 2021, fqab022. https://academic.oup.com/dsh/advance-article-abstract/doi/10.1093/llc/fqab022/6205945.
———. 2020b. “Au croisement des contenus et de la matière : l’architecture des sept pandectes bibliques grecques du premier millénaire.” Scrineum 17:3–106. https://dx.doi.org/10.13128/scrineum-11466.
Batovici, D. 2015. “The Appearance of Hermas’s Text in Codex Sinaiticus.” In Codex Sinaiticus: New Perspectives on the Ancient Biblical Manuscript, ed. S. McKendrick, D. C. Parker, A. Myshrall, and C. O’Hogan, 149–159. London.
Bausi, A., et al., eds. 2015. Comparative Oriental Manuscript Studies: An Introduction. Hamburg.
Clivaz, C. 2019. “Returning to Mark 16, 8: What’s new?” Ephemerides Theologicae Lovanienses 95:645–659. https://poj.peeters-leuven.be/secure/POJ/viewpdf.php?ticket_id=5e521a06396ca.
Dirkse, S., P. Andrist, and M. Wallraff. 2019. “Structural Visualization of Manuscripts (StruViMan): Principles, Methods, Prospects.” Open Theology 6:249–258. https://www.degruyter.com/view/j/opth.2019.5.issue-1/opth-2019-0009/opth-2019-0009.xml.
Friedrich M., and C. Schwarke. 2016. “Introduction – Manuscripts as Evolving Entities.” In One-Volume Libraries: Composite and Multiple-Text Manuscripts, ed. M. Friedrich and C. Schwarke, 1–26. Studies in Manuscript Cultures 9. Berlin.
Gumbert, J. P. 1991. IIMM… Introduction. Rules. Instructions. Jerusalem.
———. 2004. “Codicological Units: Towards a Terminology for the Stratigraphy of the Non-Homogeneous Codex.” In Il codice miscellaneo, tipologia e funzioni: Atti del convegno internazionale (Cassino, 14–17 maggio 2003), ed. E. Crisci and O. Pecere, 17–42. Segno e testo 2. Cassino.
Maniaci, M. 2004. “Il codice greco ‘non unitario’. Tipologia e terminologia.” In Il codice miscellaneo, tipologia e funzioni: Atti del convegno internazionale (Cassino, 14–17 maggio 2003), ed. E. Crisci, and O. Pecere, 75–107. Segno e testo 2. Cassino.
———. 2018. “Miscellaneous Reflections on the Complexity of Medieval Manuscripts.” In Collecting, Organizing and Transmitting Knowledge. Miscellanies in Late Medieval Europe, ed. S. Corbellini, G. Murano, and G. Signore, 11–22. Bibliologia 49. Turnhout.
Pisano, S. 2009. “The Vaticanus graecus 1209: A Witness to the Text of the New Testament.” In Le manuscrit B de la Bible (Vaticanus graecus 1209): Introduction au fac-similé; Actes du Colloque de Genève (11 juin 2001); Contributions supplémentaires, ed. P. Andrist, 77–97. Histoire du texte biblique 7. Lausanne.
Porter, D., A. Campagnolo, and E. Connelly. 2017. “VisColl: A New Collation Tool for Manuscript Studies.” In Kodikologie & Paläographie Im Digitalen Zeitalter 4, ed. H. Busch, F. Fischer, and P. Sahle, 81–100. Schriften des Instituts für Dokumentologie und Editorik 11. Norderstedt. https://www.academia.edu/34571145/VisColl_A_New_Collation_Tool_for_Manuscript_Studies.
Turner, E. G. 1977. The Typology of the Early Codex. Haney Foundation series 18. Philadelphia.
Versace, P. 2018. I marginalia del Codex Vaticanus. Studi e Testi 528. Vatican City.
Wallraff, M., and P. Andrist. 2015. “Paratexts of the Bible: A New Research Project on Greek Textual Transmission.” Early Christianity 6:237–243. https://www.academia.edu/44446896/Paratexts_of_the_Bible_A_New_Research_Project_on_Greek_Textual_Transmission.
Footnotes
[ back ] * I am grateful to the ERC and Martin Wallraff who supported and encouraged my work (within the project ParaTexBib = Paratexts of the Greek Bible); as well as Saskia Dirkse, with whom I discussed several points and who carefully corrected my English.
[ back ] 1. Andrist, Canart, and Maniaci 2013:10–26, 41–44; chap. 1.1 and 1.3 in the second English edition.
[ back ] 2. Gumbert 2004. The central point in Gumbert’s method is to group together series of quires from multi-quire codices, based on the analysis of concomitant discontinuities between texts and quires. On the origin of multi-quire codices, see the seminal work by Eric Turner (Turner 1977), particularly 98–100.
[ back ] 3. Andrist, Canart, and Maniaci 2013. For other works on structural codicology, see also Maniaci 2004 and 2018; Andrist 2016 (English summary in Andrist 2019); Friedrich and Schwarke 2016, etc.
[ back ] 4. Andrist, Canart, and Maniaci 2013:135-169, including a comparative example of four descriptions of Vat. gr. 469 (Città del Vaticano, Biblioteca Apostolica Vaticana, Vat. gr. 469 – diktyon 67100), which shows the interest of full descriptions following the syntactical model.
[ back ] 5. Andrist, Canart, and Maniaci 2013:26–27, 39 (=Nr. 1.1.12 and 2.2.38); see Nr. 1.1.13=2007.1, as well as 2008.1, 2018.2 in the second (English) edition.
[ back ] 7. See in particular Andrist 2010, 2014, and 2020a. A good illustration of this kind of problem is codex Barocci 33 (Oxford, Bodl. Libr., Barocci 33 – diktyon 47319), as explained and illustrated online at the conference DH in Utrecht in 2019. In both the on-line description (based on an ancient catalogue; https://medieval.bodleian.ox.ac.uk/catalog/manuscript_1090/; https://digital.bodleian.ox.ac.uk/objects/c500c6af-c271-4fa2-b376-fb05a7c1d08d/; accessed in December 2020), the only date information recorded in the metadata is 1595. In reality, this applies solely to the third and last main Production Units (on this concept, see below). Since the data model is not syntactical, the date is automatically put in relation with all the other data and not just to the third part of the codex. As a result, the texts of the first part, copied in the 15th century, are not found when searched with a time limit of the 15th century, but only when the search limits include the 16th century. About this manuscript and various possible ways to describe it, see Andrist 2014.
[ back ] 8. Besides the author, who coordinated the work, the members of this group were Christian Riepl, Nathan Gibson, Saskia Dirkse, Tobias Englmeier, and Caroline Strolz. For some of our conclusions about the limits of current databases, see Andrist 2020a, in which some of the ideas further developed in this article are already mentioned.
[ back ] 9. In the context of our project our first envisioned usage of such tools would be the study of pandects and other similar Bibles.
[ back ] 10. On description models for ancient manuscripts, see Andrist 2014 and Andrist 2015a. In these articles, I distinguish between the traditional scholarly description models, in which all the information about one feature of the manuscripts is grouped together, as in the example above, and the more structured syntactical models, in which the information is presented according to the Production Units of the codex (i.e. its main codicological parts; see paragraph 3 below).
[ back ] 11. Biblioteca Apostolica Vaticana, Vat. gr. 1209 (= diktyon 67840) – UniProd A, 4th cent.; UniProd B, 15th cent. – Rahlfs B for the Old Testament; GA 03 (=B) for the New Testament. – Reproduced on the web site of the Vatican Library.
[ back ] 12. For a methodological explanation about the various structure levels in the architecture of a codex, see now Andrist 2020b:5–17; about the Codex Vaticanus, see p. 17–22. For the underlying theory and principles, see Andrist, Canart, and Maniaci 2013.
[ back ] 13. In reality, there are many more Production Units, as, for example, one may see in Versace 2018.
[ back ] 14. These are places within the same UniProd where a text begins with a new quire; see Andrist 2020b:8–9.
[ back ] 15. Where possible, one row represents 50 pages; quire numbers reflect the current situation, which means the original number minus one.
[ back ] 16. For more on the question of the ending of Mark, see now Clivaz 2019; about the ending of Mark in codex Vaticanus, see also the remarks of Stephen Pisano in Pisano 2009:89, and Andrist 2020b:21.
[ back ] 17. Today, it exists in four volumes: London, British Library, Royal 01 D V (= diktyon 74390): Gen. – 2 Par. ; Royal 01 D VI (= diktyon 74391): XII Proph. – 4 Mach. ; Royal 01 D VII (= diktyon 74392) : Libri poetici ; Royal 01 D VIII (= diktyon 39763): New Testament. – Dated to the third quarter of the 5th cent. – Rahlfs A for the Old Testament; GA 02 (= A) for the New Testament. – The fourth volume is reproduced on the website of the British Library.
[ back ] 18. Bern, Burgerbibliothek, cod. 469 (= diktyon 9563) – UniProd A, 16th cent. med. ; UniProd B, datable in 1552; UniProd C, s. XVI 2/2 – Reproduced on e-codices.
[ back ] 19. As explained in the bibliography above, the choice of the observed features also depends on the codex under observation and the conditions of the observation (online, or in person, etc.). For example, decoration or ink could be also features to take into account. The acronym in the diagrams are a shorthand system to ensure that data is recorded in a consistent and uniform way. For a full explanation of the system (which blends some English and French terms) and a more developed example, see Andrist, Canart, and Maniaci 2013:111–134 (= chapter 6 in the forthcoming English second edition).
[ back ] 20. The column for the folios offers a greater degree of precision for locating any information that occurs within the same row, if necessary.
[ back ] 21. Software such as VisColl, which can already help describe and represent the quire structure of a codex precisely, is certainly part of realizing this first step; see Porter, Campagnolo, and Connelly 2017.
[ back ] 22. The first version of the tool, developed in the framework of a proof of concept project launched by Martin Wallraff, is accessible from the manuscript descriptions in the above mentioned Public Interface of the Paratexts of the Bible project (https://www.manuscripta-biblica.org/manuscript-search). On StruViMan, see Dirkse, Andrist, and Wallraff 2019. On this Paratexts project, see Wallraff and Andrist 2015, and the website https://www.manuscripta-biblica.org/.
[ back ] 23. On the inexistence of an objective description, see to Andrist 2015b:521.